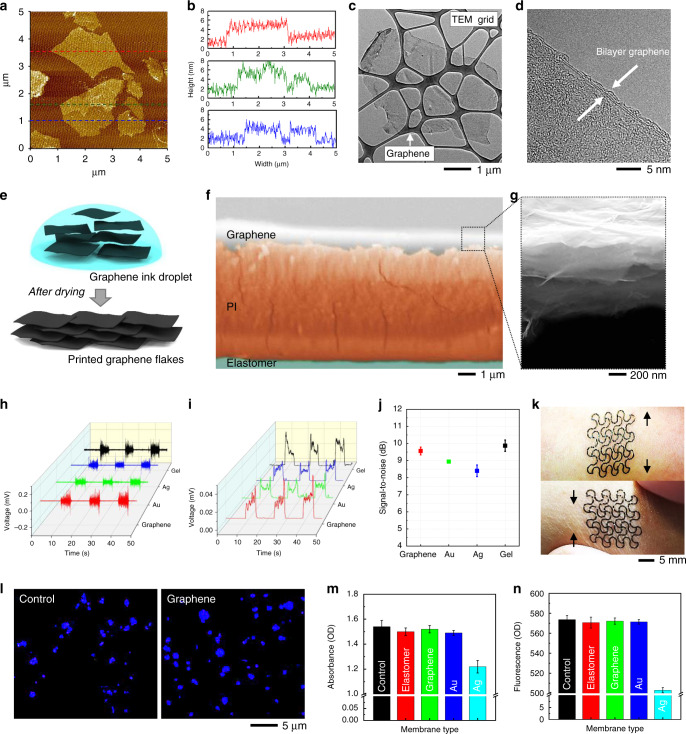
Fig. 2. Fabrication and characterization of a FCG and its application as a sensor.
a AFM image (top view) of a FCG that was initially dispersed in aqueous ink on a mica substrate. b Three height profiles of FCG flakes, corresponding to three dotted lines in a. c, d TEM images of a FCG with a low-resolution view (c) and high-resolution view (d). e Schematic illustration representing the stacking process of printed FCG before and after drying of an ink droplet. f Colorized, cross-sectional SEM image, showing a multilayered sensor structure, including graphene, PI, and elastomeric substrate. g Enlarged view of the SEM image in f, showing the stacked FCG layers with total thickness of 800 nm. h Recorded EMG signals on forearm that compare the signal amplitudes with four electrodes, made of printed FCG (red), Au (green), Ag (blue), and commercial metal/gel (black). i Root-mean-squared data of EMG signals from (h). j Averaged signal-to-noise ratio of EMG data from a printed FCG (red), Au (green), Ag (blue), and commercial gel electrode (black): error bars show standard deviation (n = 3). k Optical images showing a conformal lamination and stretchability of the FCG electrode on the skin: longitudinal stretching (top) and compression (bottom) on forearm. l Optical microscopic images of cultured keratinocyte cells after exposure to original DMEM (left; control sample) and DMEM with graphene (right) after 7 days of culture. m, n Comparison of cell absorbance (m) and fluorescence intensity (n) of cultured keratinocyte cells on five types of membranes, including control, elastomer, graphene, Au, and Ag. Overall, these data capture the cell friendly environments of a graphene electrode on an elastomeric membrane.

