Figure 2.

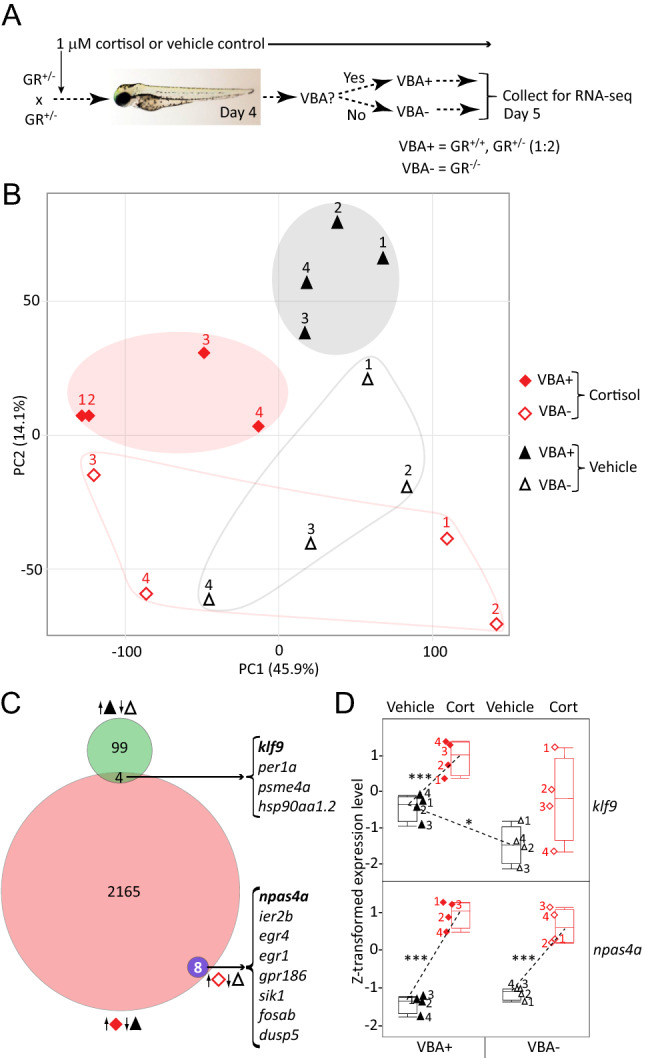
RNA-seq identifies GR-dependent and GR-independent genes and effects of chronic cortisol treatment. (A) Diagram of experimental design using Visual Background Adaptation (VBA) selection. (B) Principal component plot of the RNA-seq data, showing the location of each replicate sample with respect to the first two principal components. Cortisol-treated samples are shown in red, vehicle-treated controls in black. VBA+ samples (containing at least one functional GR allele) are filled shapes, VBA- samples are empty shapes. (C) Venn diagram showing numbers of genes upregulated in each of the indicated comparisons (keyed as in (A)): VBA+ vs. VBA- (vehicle-treated controls); cortisol-treated vs. vehicle-treated VBA+; and cortisol-treated vs. vehicle treated VBA-. Upregulated genes in common respectively between the first two and the last two comparisons are listed on the right. (D) Box plots of Z-transformed expression levels of klf9 and npas4a obtained from the RNA-seq data. Sample numbers correspond to those in (B). Asterisks indicate significant differential expression (adjusted p values): ***< .0001; *< .05.
