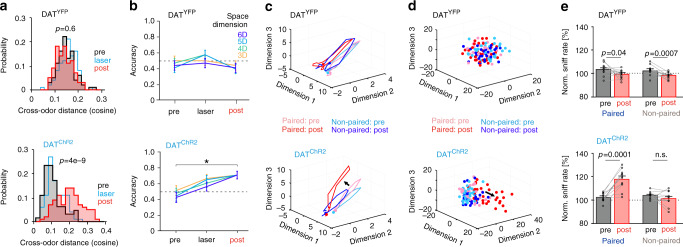
Fig. 2. Phasic DA increases the difference between the paired and non-paired odor encoding and improves decoding.
a Distribution of the cosine distance between the two odor responses during ‘pre’ and ‘post’ phases. After pDA pairing, cross-odor distance increased only in DATChR2 mice (two-way ANOVA; factors: cohort, odor; interaction effect: F(1,360) = 90.6, p = 3 × 10⁻¹⁹; post hoc comparisons indicated, Tukey’s correction). b Quadratic discriminant analysis between paired and non-paired odor responses. Only in DATChR2 mice, laser pairing improved the average accuracy (two-sided Fisher’s exact test between ‘pre’ vs ‘post’; multiple state space dimensions are tested to confirm the robustness, α = 0.05 with Benjamini–Hochberg correction on tests performed on all dimensions and cohorts, DATChR2: asterisk mark significance for all dimensions, DATYFP: no significance in any dimension. DATYFP: n = 60 accuracy values for all dimensions and phases; DATChR2: n = 52/62/62 accuracy values for all dimensions and for ‘pre’/’laser’/’post’ phases, resp.; displayed mean ± S.E.). c Averaged trajectories for paired and non-paired SPN odor responses visualized through factor analysis after time embedding (dots mark the beginning of the trial). Trajectories were jointly rotated to improve visualization. d Trial-specific odor responses visualized through multidimensional scaling. pDA pairing separated the paired odor representation from its original representation and from the one of the non-paired odor. e Mean sniff rate ± S.E. following odor onset normalized to baseline. The sniff rate increased only for the odor paired with pDA stimulation in DATChR2 mice (two-sided paired t-test). Source data are provided as a Source data file. See also Supplementary Figs. 4 and 5.

