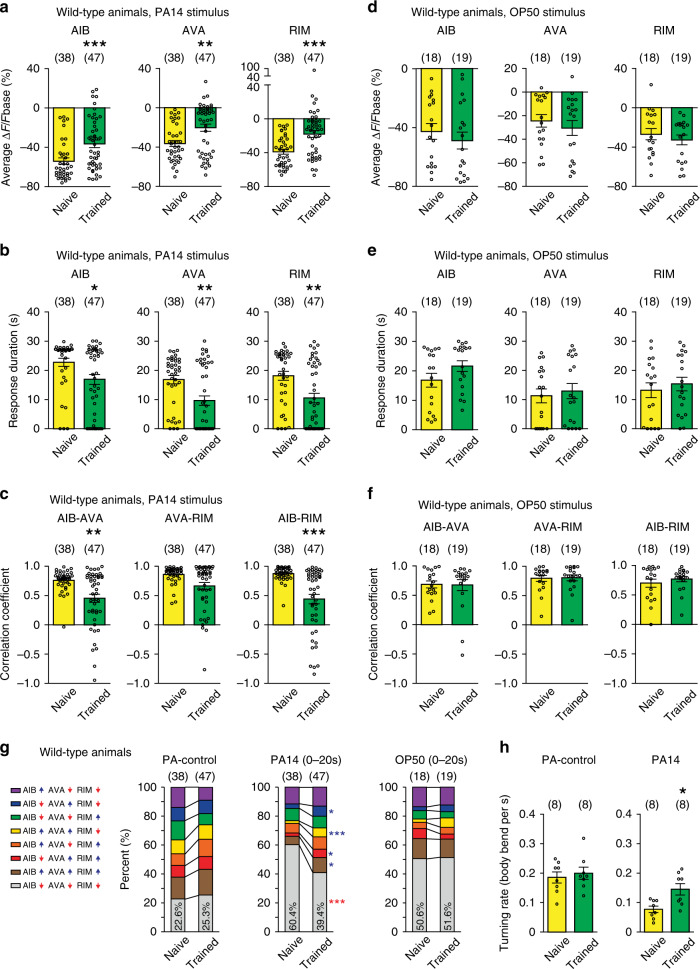
Fig. 2. Olfactory learning modulates PA14-evoked responses in AIB, AVA, and RIM.
a–c The average response amplitude (a), response duration (b), correlation coefficients (c) of PA14-evoked GCaMP3 signals of AIB, AVA, and RIM in naive and trained wild-type animals (“Methods”). d–f The average response amplitude (d), response duration (e), and correlation coefficients (f) of OP50-evoked GCaMP3 signals of AIB, AVA, and RIM in naive and trained wild-type animals (“Methods”). For (a–f), average response amplitude and correlation coefficients are measured for GCaMP3 signals during 30 s PA14 stimulation or 30 s OP50 stimulation (a, c, d, f), and response duration is measured for responses with ∆F/Fbase < −30% (b, e). g Patterns of GCaMP3 signals in AIB, AVA, and RIM that are evoked by PA14 (0–20 s exposure to PA14), or by PA-control, or by OP50 (0–20 s exposure to OP50) in wild-type animals. Upward pointing or downward pointing arrow following each neuron respectively denotes a positive or a negative value for time derivative of GCaMP3 signal of the neuron (“Methods”). Mean values are presented here, and Supplementary Fig. 9 show mean, s.e.m., individual data points, and p values. For (a–g), parentheses contain the numbers of animals examined over 9 (PA14 exposure) or 3 (OP50 exposure) independent experiments. h Turning rates in response to PA14 and PA-control in naive and trained wild-type animals, parentheses contain the numbers of assays measured over eight independent experiments. For all, naive and trained animals are compared using two-sided Mann–Whitney U test (a–f) or two-sided Mann–Whitney U test with Bonferroni correction (g) or two-sided Welch’s t-test (h), asterisks indicate significant difference, ***p < 0.001, **p < 0.01, *p < 0.05, mean ± s.e.m., circles indicate individual data points. The p values in the following panels, from left to right, are: a 0.0005, 0.0019, <0.0001; b 0.014, 0.0039, 0.0011; c 0.0047, 0.10, <0.0001; d 0.40, 0.37, 0.34; e 0.54, 0.43, 0.45; f 0.66, 0.91, >0.99; h 0.62, 0.011. Source data are provided as a Source Data file.

