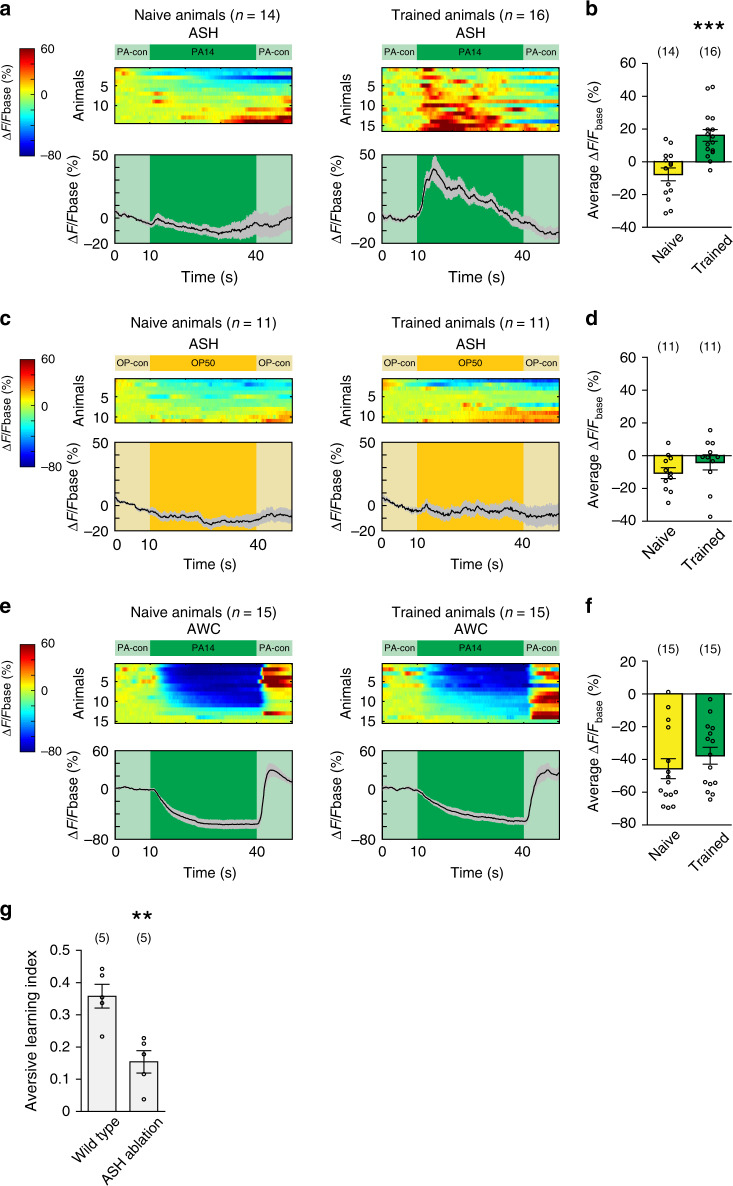
Fig. 4. Olfactory learning modulates PA14-evoked response of ASH.
a–f GCaMP6 signals of ASH (a–d) and AWC (e, f) evoked by PA14 and control (a, b, e, f) or by OP50 and control (c, d) in naive and trained animals. ∆F = F−Fbase and Fbase is the average GCaMP6 signal in the 10 s window before PA14 or OP50 stimulation. Spectrums indicate the ranges of ∆F/Fbase (%) and ∆F/Fbase (%) are outside of indicated ranges for some frames. In a, c, and e, top panels show GCaMP6 signals of ASH or AWC in individual animals, which are arranged based on response amplitude, and bottom panels show mean values and s.e.m. In b, d, and f, average response amplitude is measured for GCaMP6 signals during 30-s stimulation of PA14 or OP50. Parentheses contain the numbers of animals examined over 4 (a, b) or 2 (c–f) independent experiments, circles indicate individual data points, mean ± s.e.m. Naive and trained animals are compared using two-sided Welch’s t-test (b p = 0.0001; f p = 0.33) or two-sided Mann–Whitney U test (d p = 0.15), asterisks indicate significant difference, ***p < 0.001. g Genetically ablating ASH disrupts learning. Wild-type and ASH-ablated animals are compared using two-sided Welch’s t-test (p = 0.0039), parentheses contain the numbers of assays measured over four independent experiments, circles indicate individual data points, asterisks indicate significant difference, mean ± s.e.m., **p < 0.01. Source data are provided as a Source Data file.

