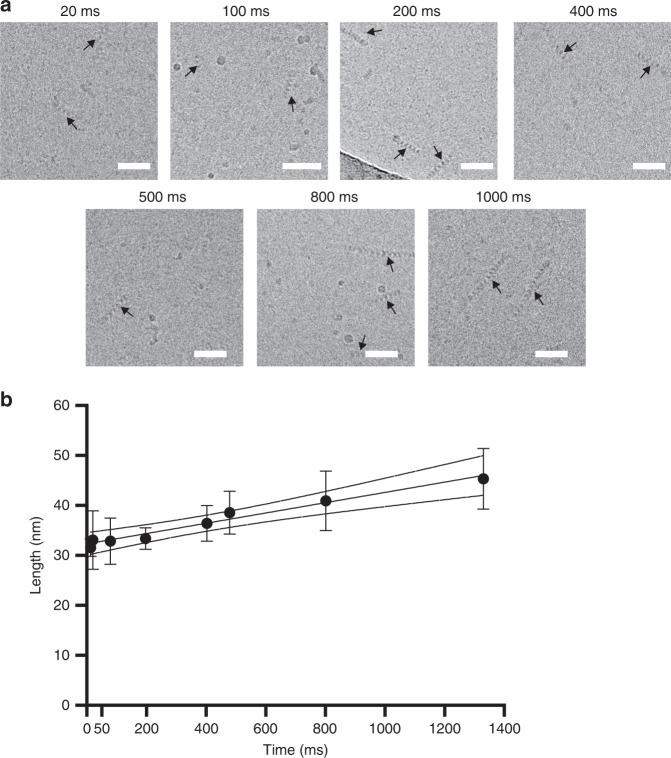
Fig. 6. Kinetic analysis of RecA-ssDNA filament growth by time-resolved cryo-EM.
a Example micrograph of each studied time point indicated in milliseconds. Scale bars are 50 nm. b Growth curve quantifying the averages of the median lengths of at least three replicates per time point, shown are standard deviations (error bars) and the 95% confidence interval of the linear regression fit. R-squared of the fit through the means of medians is 0.973. Source data are provided as a Source Data file.

