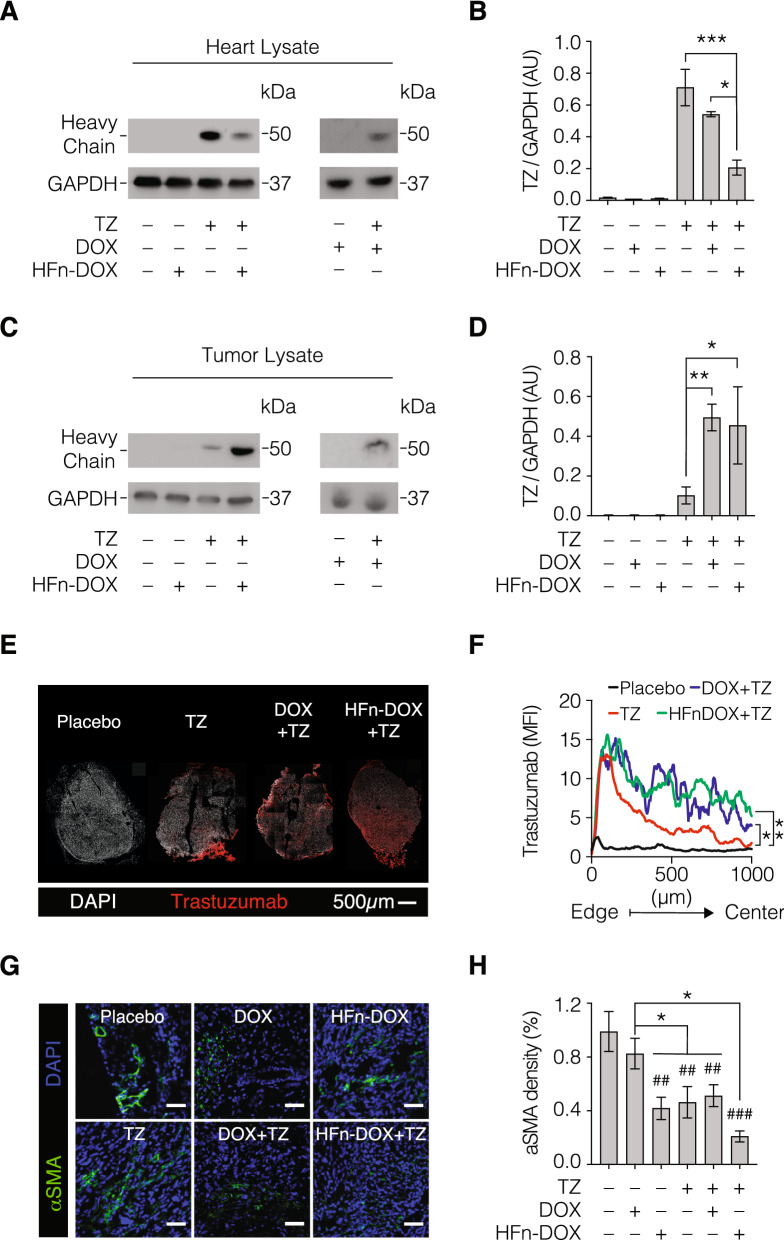
Figure 3.
TZ quantification in heart and tumor tissue. Western blot analysis of hearts (panels A and B) and tumor (panels C and D) excised at the end of treatment to quantify TZ. (A,C) Representative results of western blots performed to quantify TZ, constituted by cropped western blots revealed with anti-human IgG HRP antibody and anti-GAPDH, respectively. (B,D) TZ quantification in heart and tumor, respectively. TZ was normalized on GAPDH using ImageJ Software. Reported values are the mean of 3 samples ± s.e. Statistical significance vs. TZ, *P < 0.05, **P < 0.01, ***p < 0.005. (E) Representative images of confocal microscopy analysis of TZ penetration in tumor from mice treated with placebo,TZ alone or in combination with HFn-DOX or DOX. DAPI signal is white, while TZ is labelled in red. Scale bar = 500 μm. (F) Analysis of spatial distribution of TZ fluorescence signal. Quantification of mean fluorescence intensity (MFI) of anti-Trastuzumab staining along the tumor axis from the edge to the geometric center (mean ± s.e [s.e. bars in grey color]; n = 3 tumor mosaics/staining; statistical comparisons between measurement points are shown). The black line represents the calculated average background of stained tumor cryosections from mice treated without trastuzumab (n = 3). Statistical significance vs. TZ, *P < 0.05, **P < 0.01. (G) Representative images of α-SMA labelling in frozen cryosections of tumors from treated mice (n = 3/group) to assess the amount of Cancer Associated Fibrolasts (CAF). (H) Quantification of the fluorescence signal of α-SMA labelling. Reported values are the mean of 3 samples ± s.e. Statistical significance vs. placebo ##P < 0.01, ###P < 0.005; vs DOX *P < 0.05.

