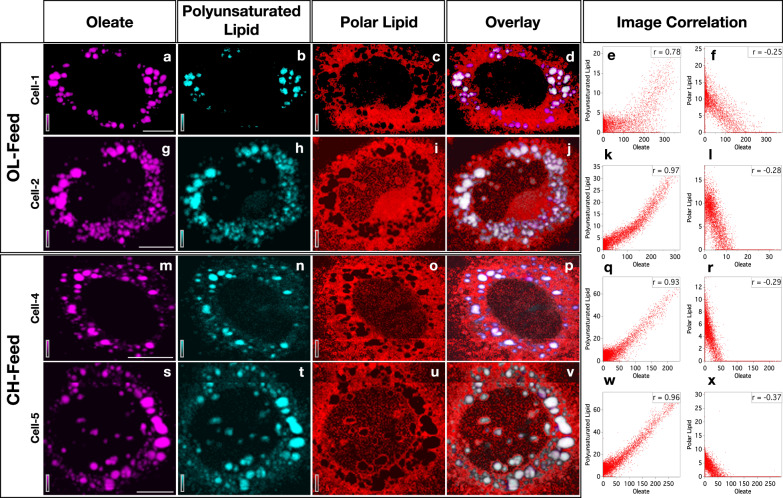
Fig. 2. Distribution of lipids in HuH7 cells.
Each row represents Raman images from one cell examined. The cell-1 and cell-2 were cultured under OL-feed and the cell-3 and cell-4 under CH-feed. Each column represents distribution of one specific molecular component as indicated at the column header: images in the first column (a, g, m, and s) represent the distribution of oleate in the corresponding cells. Overlay of lipid distributions are provided in the fourth column (d, j, p, and v). Oleate (a, g, m, and s) and polyunsaturated lipid (b, h, n, and t) are richly localized in LDs while polar lipid is distributed in the cytosol (c, i, o, and u). Images from four representative cells are shown here (see Supplementary Fig. 3 for full list). Pearson image correlation plots for lipids are shown in the last two columns (e, k, q, w, f, l, r, and x). Correlation coefficients are indicated as insets in each plot. Scale bar 10 μm.

