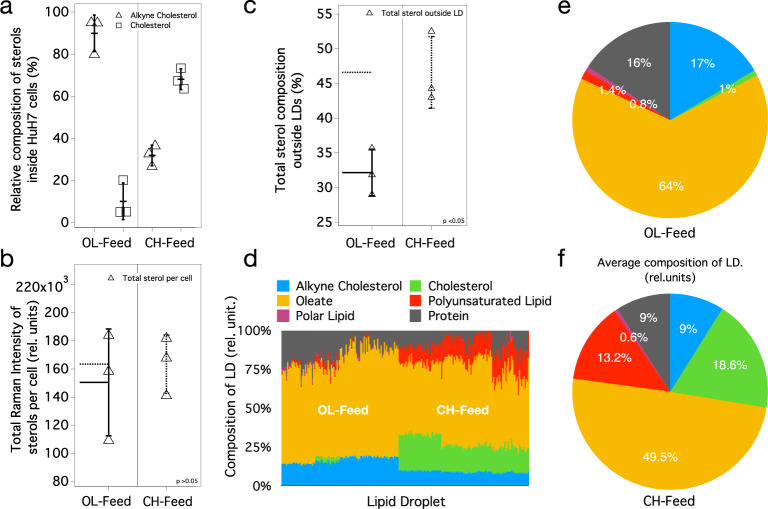
Fig. 5. Results of molecular Profiling of LDs.
a Percent compositions (Raman intensities) of alkyne cholesterol and cholesterol inside HuH7 cells (relative to total sterol) under two different feed conditions. The error bars (vertical lines) represent standard deviations and the mean value is denoted by a horizontal line. Sample size, n = 3. b Total Raman intensities of sterols (cholesterol + alkyne cholesterol) inside the whole cell (p = 0.64); total sterol uptake is comparable under two feed conditions. Sample size, n = 3. c Total sterol composition outside LDs under two feed conditions. Statistically significant (p = 0.02) excess composition of sterols was found outside LDs under CH-feed. Sample size, n = 3. d Molecular composition of individual LDs under two culture conditions. The height of each colored bar represents area normalized Raman intensity inside each LD (in % scale). The pie charts e and f show the average values of area normalized total Raman intensities of individual molecular components under two different feed conditions. The Raman intensities are proportional to concentration and can be converted to absolute concentrations by knowing Raman cross-sections. See “Methods” for details of estimating the presented values.

