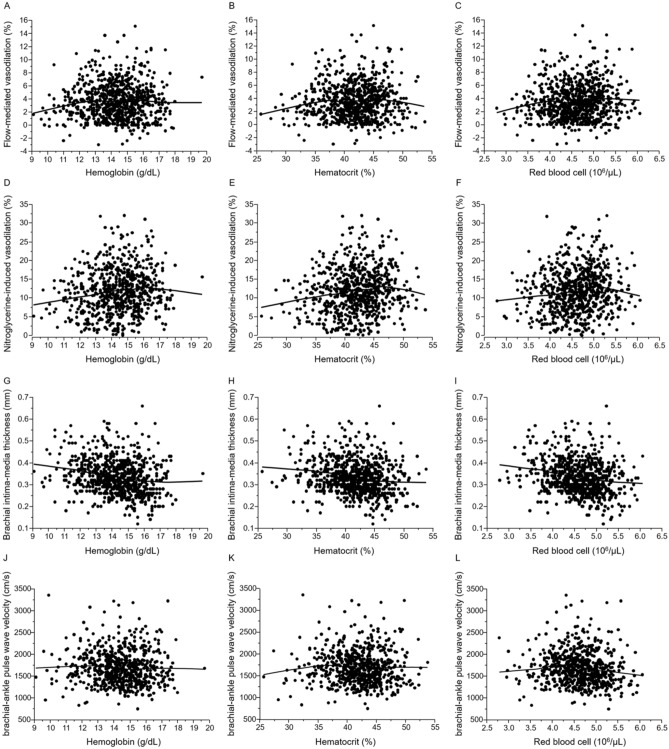
Figure 1.
Scatter plots show the relationships of hemoglobin (A), hematocrit (B), and red blood cell (C) with flow-mediated vasodilation, the relationships of hemoglobin (D), hematocrit (E), and red blood cell (F) with nitroglycerine-induced vasodilation, the relationships of hemoglobin (G), hematocrit (H), and red blood cell (I) with brachial intima-media thickness and the relationships of hemoglobin (J), hematocrit (K), and red blood cell (L) with brachial-ankle pulse wave velocity.

