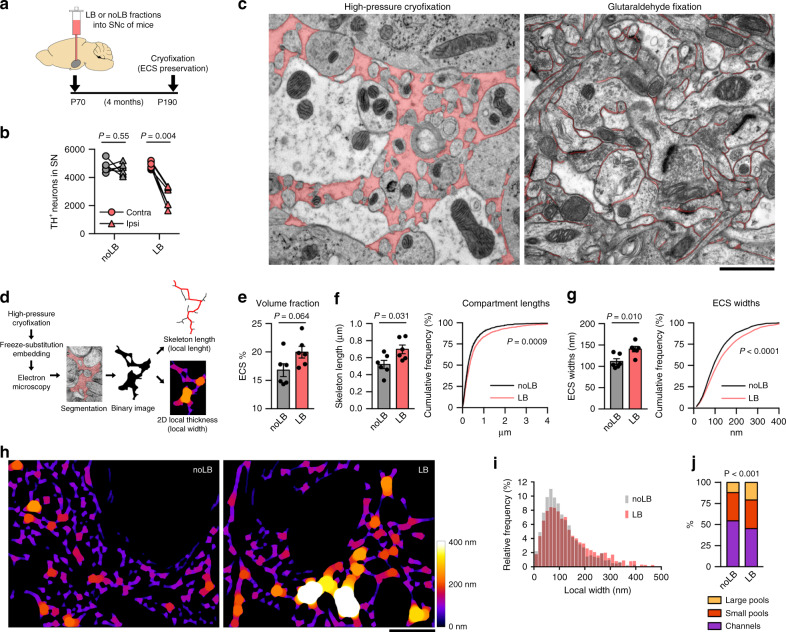
Fig. 1. α-syn-induced neurodegeneration enlarges the extracellular space locally.
a Experimental timeline of the mouse model of Lewy body (LB)-induced neurodegeneration. b TH stereological cell counts confirmed 40% dopaminergic cell loss typically observed in the SN of LB-inoculated mice (paired two-tailed Student’s t test, n = 6 mice). c Ultramicrographs of cryofixed (left) vs chemically fixed (right) brain tissue (ECS is pseudo-colored). Classic glutaraldehyde fixation artefactually reduces ECS size, whereas high-pressure cryofixation represents more accurately ECS dimensions. Scale bar, 1 µm. d Schematic diagram of cryofixation, freeze-substitution, EM and image analysis protocol. e ECS volume fraction in the SN of LB and noLB-mice (two-tailed Student’s t test, n = 6 SNs). f, g Mean and cumulative distribution of ECS compartment lengths (f) and local widths (g) in the SN after LB-induced neurodegeneration (Two-tailed Student’s t test and Kolmogorov–Smirnov test, n = 6 SNs). h ECS local width maps from Ctrl and LB-inoculated mice display the characteristic channels-and-pools configuration of the ECS, revealing increased dimensions in the degenerated SN. Scale bar, 1 µm. i Distribution of ECS local widths from all maps generated in the study. j Proportions of ECS compartments categorized by width (Large pools, >200 nm; small pools, 100–200 nm; channels, <100 nm) expressed as % of ECS (Chi-square test) showing that LB-induced neurodegeneration affects how the ECS is spatially distributed. Error bars represent mean ± SEM. Source data are provided as a Source data file. See also Supplementary Figs. 1 and 2.

