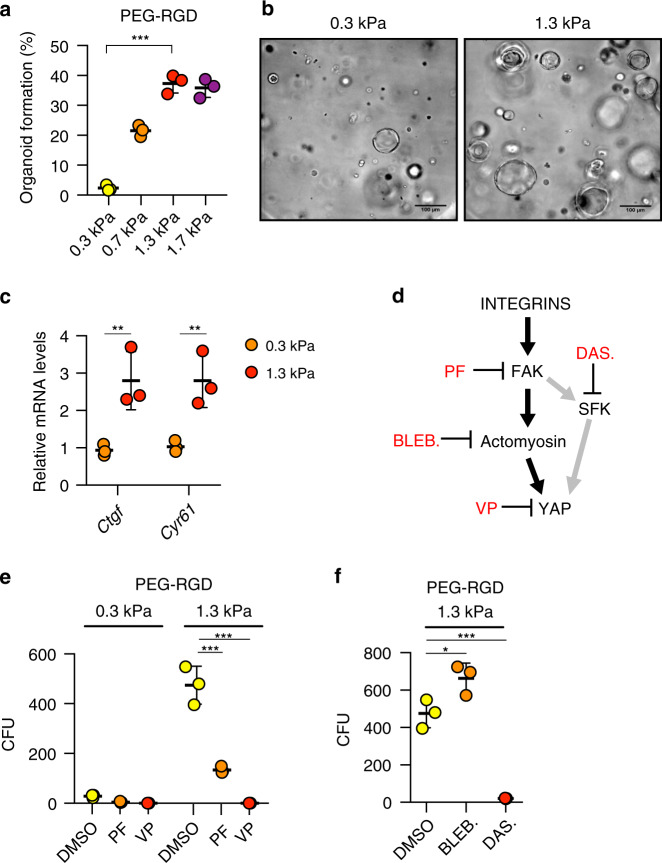
Fig. 3. Effect of matrix stiffness on liver organoid formation.
a Effect of matrix stiffness on organoid formation efficiency. Graphs show individual data points derived from n = 3 independent experiments and means ± s.d. (P < 0.0001). b Representative image of organoids 3 days after embedding in PEG-RGD hydrogels of indicated stiffness. c Gene expression was analysed by qRT-PCR in liver organoids 6 days after embedding in PEG-RGD hydrogels with indicated stiffness. Graphs show individual data points derived from n = 3 independent experiments and means ± s.d. (P = 0.0088; 0.0077). d Schematic representation of cellular mechano-signalling pathways. Inhibitors of key elements are depicted in red. e Effect of indicated inhibitors on organoid formation efficiency in soft (300 Pa) and physiologically stiff (1.3 kPa) PEG-RGD hydrogels. CFU (colony forming unit). Graphs show individual data points derived from n = 3 independent experiments and means ± s.d. (P < 0.0001). f Effect of indicated inhibitors on organoid formation efficiency in physiologically stiff (1.3 kPa) PEG-RGD hydrogels. CFU (colony forming unit). Graphs show individual data points derived from n = 3 independent experiments and means ± s.d. (P = 0.0198; 0.0003). *P < 0.05, **P < 0.01, ***P < 0.001 one-way Anova (a, f) or two-way Anova (c, e). Source data are provided as a Source Data file.

