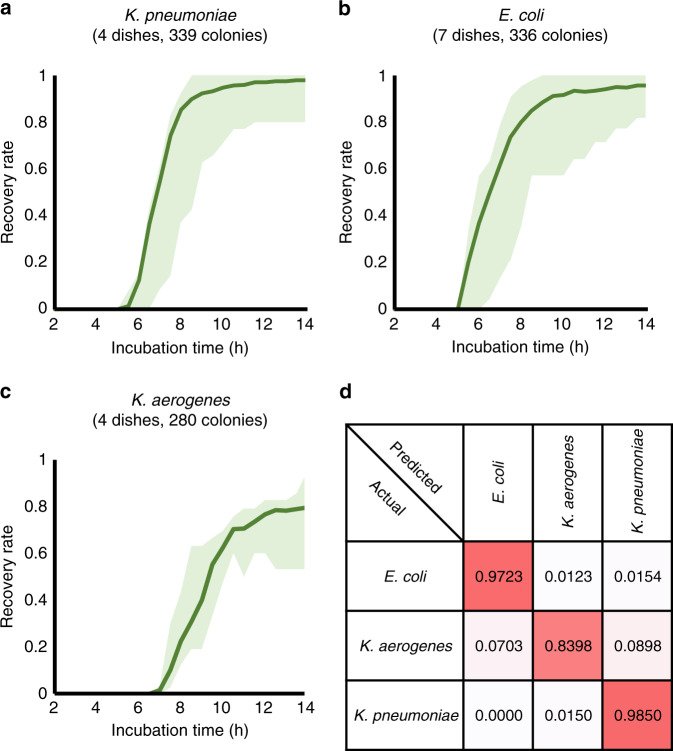
Fig. 5. Classification analysis.
Classification performance of our trained neural network for aK. pneumoniae, bE. coli, and cK. aerogenes colonies. The green shaded area in each curve represents the highest and lowest recovery rates found in all the corresponding experiments at each time point. d The blind testing confusion matrix of classifying all the colonies that were sent to our trained neural network after 12h of incubation. A diagonal entry of 1.0 means a 100% classification accuracy for that species. The numbers of colonies that were tested by the classification network in d are 325 (E. coli), 334 (K. pneumoniae), and 256 (K. aerogenes)

