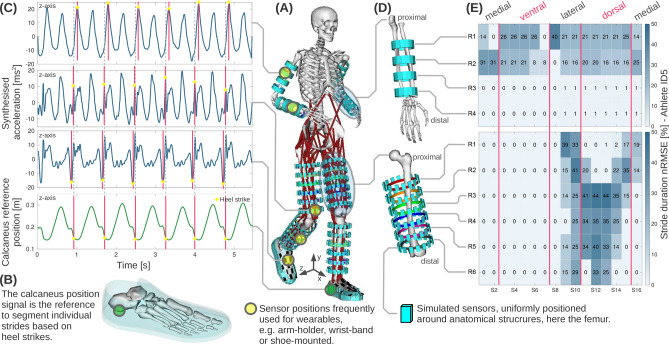
Figure 2.
Illustration of the wearable motion analysis based on biomechanical simulations and sensor data synthesis. (A) Illustration of the sensor-extended, personal full-body model while running, including 834 simulated sensors uniformly positioned at upper and lower arms and legs, as well as feet. (B) Feet models with an inertia-free shoe model used to place sensor models. The vertical calcaneus position in y-axis orientation served as stride reference. (C) Example of the acceleration time series data synthesised for each simulated sensor. (D) Zoomed view of the lower arm (64 sensors), and the upper leg (96 sensors). For visualisation of the sensor positions, the femur was rotated. (E) Normalised root-mean-square-error (nRMSE) of the marker stride duration, derived between simulated sensors and the calcaneus reference. Colour-coded nRMSE maps shown here for athlete ID5.

