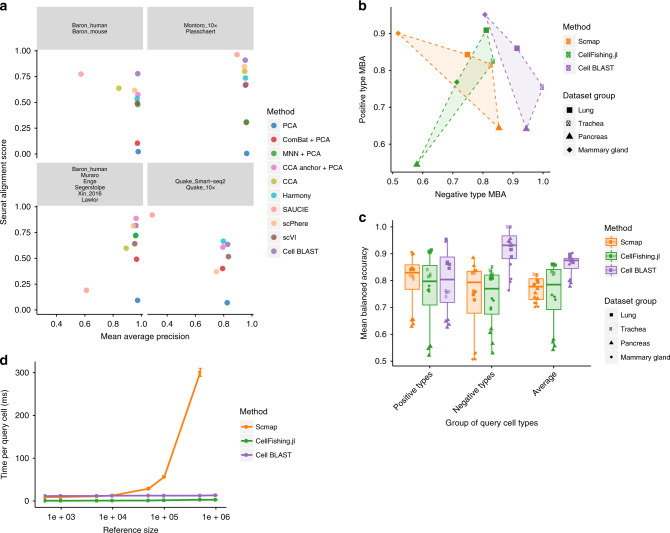
Fig. 2. Cell BLAST benchmarking.
a Extent of dataset mixing as measured by Seurat alignment score, versus cell-type resolution, as measured by mean average precision, after batch effect correction in four groups of datasets. Both scores range between 0 and 1. Specifically, a high Seurat alignment score indicates that local neighborhoods consist of cells from different datasets uniformly rather than from the same dataset only, i.e., different datasets mix well. Meanwhile, mean average precision can be thought of as a generalization to nearest-neighbor accuracy, with larger values indicating higher cell-type resolution. It is reported to ensure that dataset mixing does not blur the true biological signal. CCA and MNN failed in the last dataset due to memory errors. b MBA of query-based cell typing on positive versus negative queries. Points of the same method are outlined for clarity. As CellFishing.jl does not come with a query-based prediction method, we used the same strategy as Cell BLAST, with Hamming distance = 120 as cutoff determined from grid searching for best balance between correctly predicting positive types and rejecting negative types across all four datasets (see “Methods” and Supplementary Fig. 8a, c for more details). c MBA of query-based cell typing on positive and negative queries as well as their arithmetic average (n = 16 experiments across four query groups for each method). Box plots indicate the median (center lines), 1st and 3rd quartiles (hinges), minimal and maximal point within 1.5 times the interquartile range starting from the hinges (whiskers). d Querying speed on reference datasets of different sizes subsampled from the 1.3 M mouse brain dataset16 (n = 4 independent experiments for each method at each reference size). Error bars indicate mean ± s.d.

