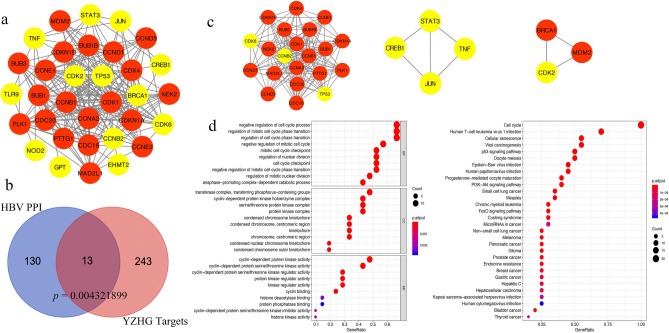
Figure 4.
(a) PPI network related to potential targets. The yellow color indicates primary proteins, and the red color indicates secondary proteins [drawn by Cytoscape 3.7.1 (https://www.cytoscape.org/)]. (b) Venn diagram of protein interactions. (c) Module analysis of the network for the identification of potential targets [drawn by Cytoscape 3.7.1 (https://www.cytoscape.org/)]. (d) The GO and KEGG diagram of module 1 [drawn by R 3.6.3 (https://cran.r-project.org/doc/FAQ/R-FAQ.html#Citing-R)].

