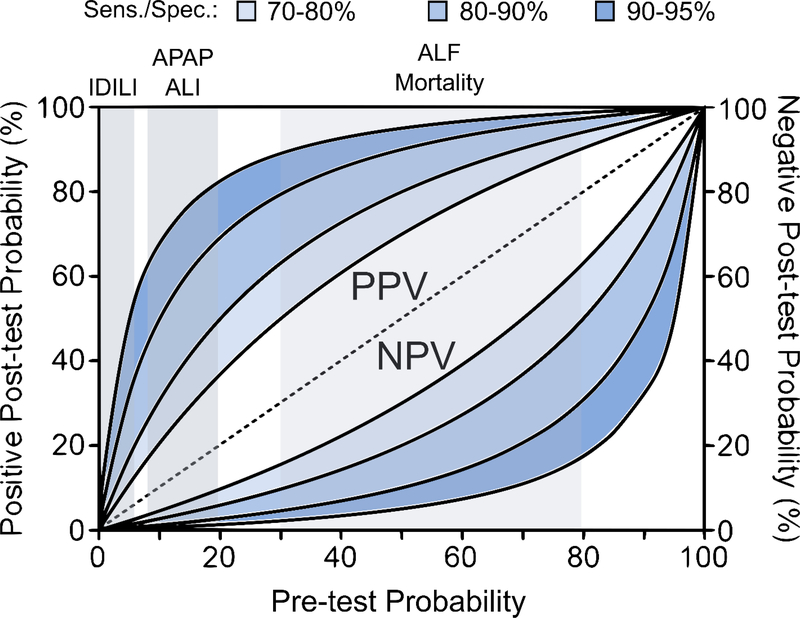
Figure 1. Relationship between prevalence and predictive values.
Positive post-test probability (left upper portion), a surrogate of PPV when pre-test probability or prevalence is estimated, increases with increasing prevalence, while negative post-test probability (right lower portion), a surrogate for negative predictive value (NPV), decreases. Blue-shaded areas show different levels sensitivity and specificity. For the different levels, both sensitivity and specificity were set at either 70%, 80%, 90%, or 95%. Vertical, grey-shaded areas show the approximate ranges of prevalence for idiosyncratic drug-induced liver injury (IDILI) among users of a given IDILI-associated drug, for acute liver injury (ALI) among early-presenting acetaminophen (APAP) overdose patients, and for mortality among acute liver failure (ALF) patients.

