
Figure 11.
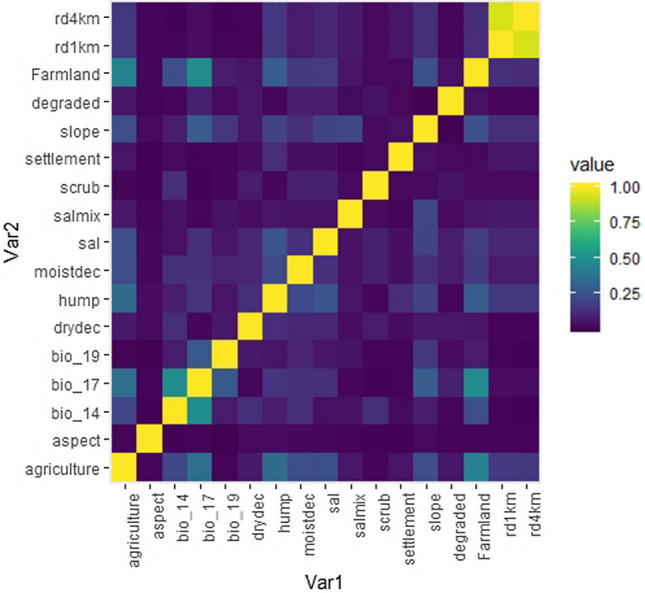
Multi-colinearity among the predictor variables used in the final random forest modelling of tiger and leopard. The multi-colinearity was tested at (r > 0.50) using the R package “rfUtilities” and correlogram was produced using the R package “ENMTools”. The road density is represented at two spatial scales (1 km and 4 km) as shown in the top right corner of the correlogram as rd1km and rd4km, and moistdec, drydec represent the moist and dry deciduous forests respectively and hump denotes the human population density defined as the number of persons per square km.