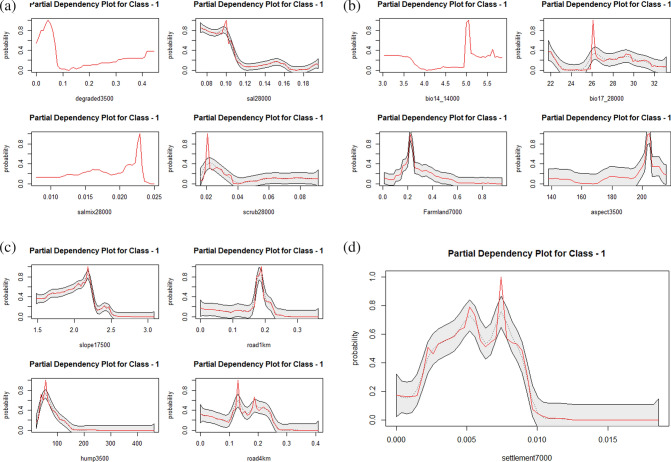
Figure 3.
(a) Partial dependency plots showing the marginal effect of degraded forests, sal dominated forests, sal mix forests and scrub patches on the predicted occurrence of tiger. (b) Partial dependency plots showing the marginal effect of bio14, bio17, farmland and aspect on the predicted occurrence of tiger. (c) Partial dependency plots showing the marginal effect of slope, human population density and road density on the predicted occurrence of tiger. (d) Partial dependency plot showing the marginal effect of human settlement on the predicted occurrence of tiger.

