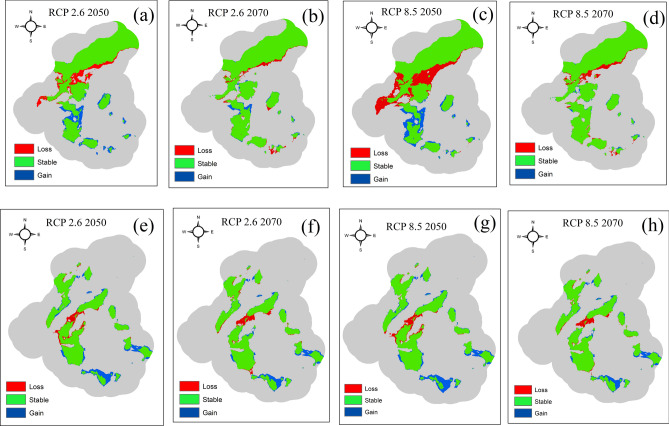
Figure 6.
Predicted change in the distribution of tigers and leopards under future climatic scenarios. Panels (a) and (b) represent the change in distribution of tiger under RCP 2.6 scenario for the years 2050s and 2070s. Panels (c) and (d) represent the change in distribution of tiger under RCP 8.5 for the years 2050s and 2070s. Panels (e) and (f) represent the change in the distribution of leopard under RCP 2.6 Scenario for the years 2050s and 2070s and panels (g) and (h) represent the predicted change in the distribution of leopard under RCP 8.5 for the years 2050s and 2070s. The map was created using ArcGIS (v 10.3) software developed by ESRI. https://www.esri.com.

