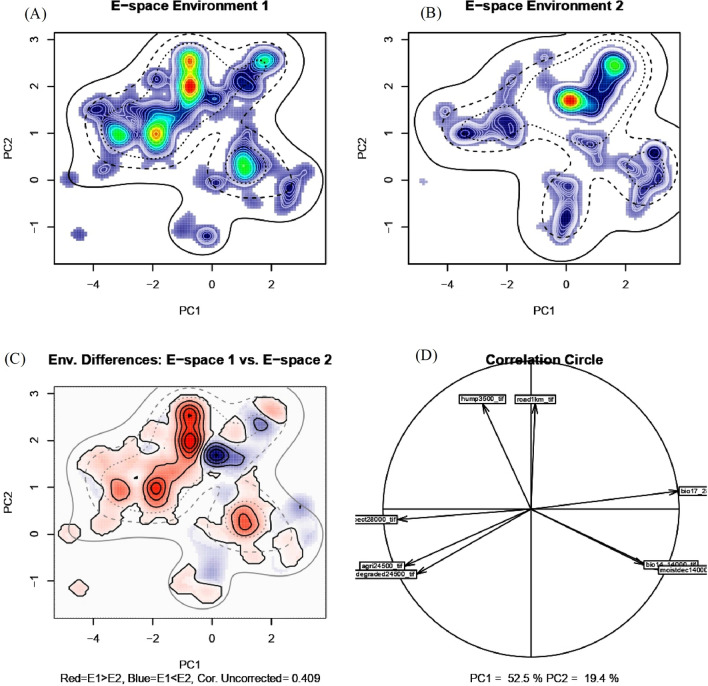
Figure 7.
Niches of tiger and leopard in two dimensional E-space. Panels (A) and (B) represent the niches of species along first two axes of the PCA. The species occurrences are represented by kernel density isopleths, red color indicates high density and cooler color (blue) indicates low density. Solid and dotted contour lines illustrate 100% and 50% of the available background (environmental space). Panel (C) represents the difference in the E-space of two species and Niche E-space Correlation Index (NECI). NCEI determines if one should correct the occurrence densities of each species by the prevalence of their environments in their range for equivalency and background tests. For high NCEI (> 0.5) species occupied niches are recommended to be corrected by the frequency of E-space in accessible environments to reduce the chances of committing type 1 errors, and panel (D) represents the correlation circle and important principal components of the raw input data.

