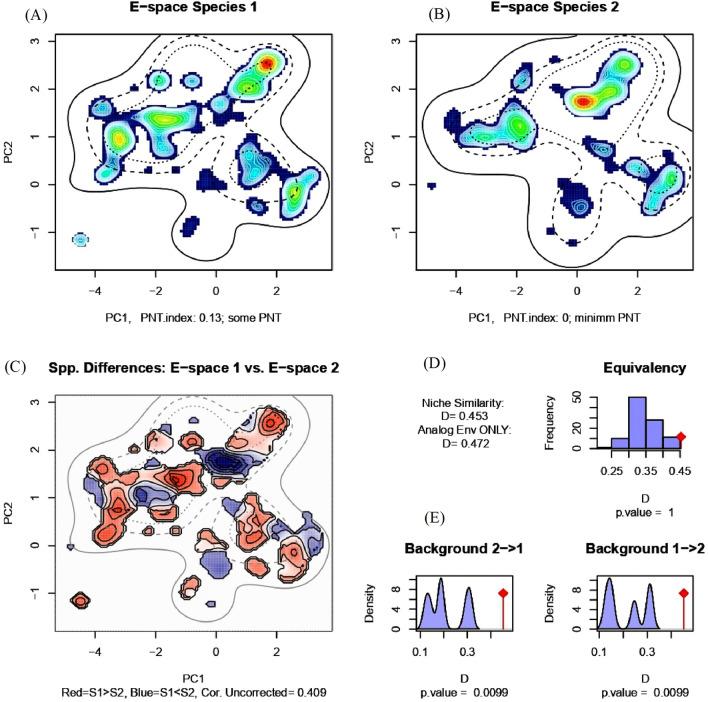
Figure 8.
Niche equivalency and niche background tests between tiger and leopard. Panels (A) and (B) represent the kernel density isopleths, red color indicates high density and cooler color (blue) indicates low density. Panels (A) and (B) also represent the Potential Niche Truncation (PNT) Index describing the amount of observed E-space of the species that is truncated by the available E-space. Panel (C) represents the difference in the E-space of two species and Niche E-space Correlation Index. Panel (D) represents the Equivalency statistic measured as Niche similarity index and panel (E) represents niche Background statistic.

