
Fig. 4. Activity of and variance explained by low-dimensional representations.
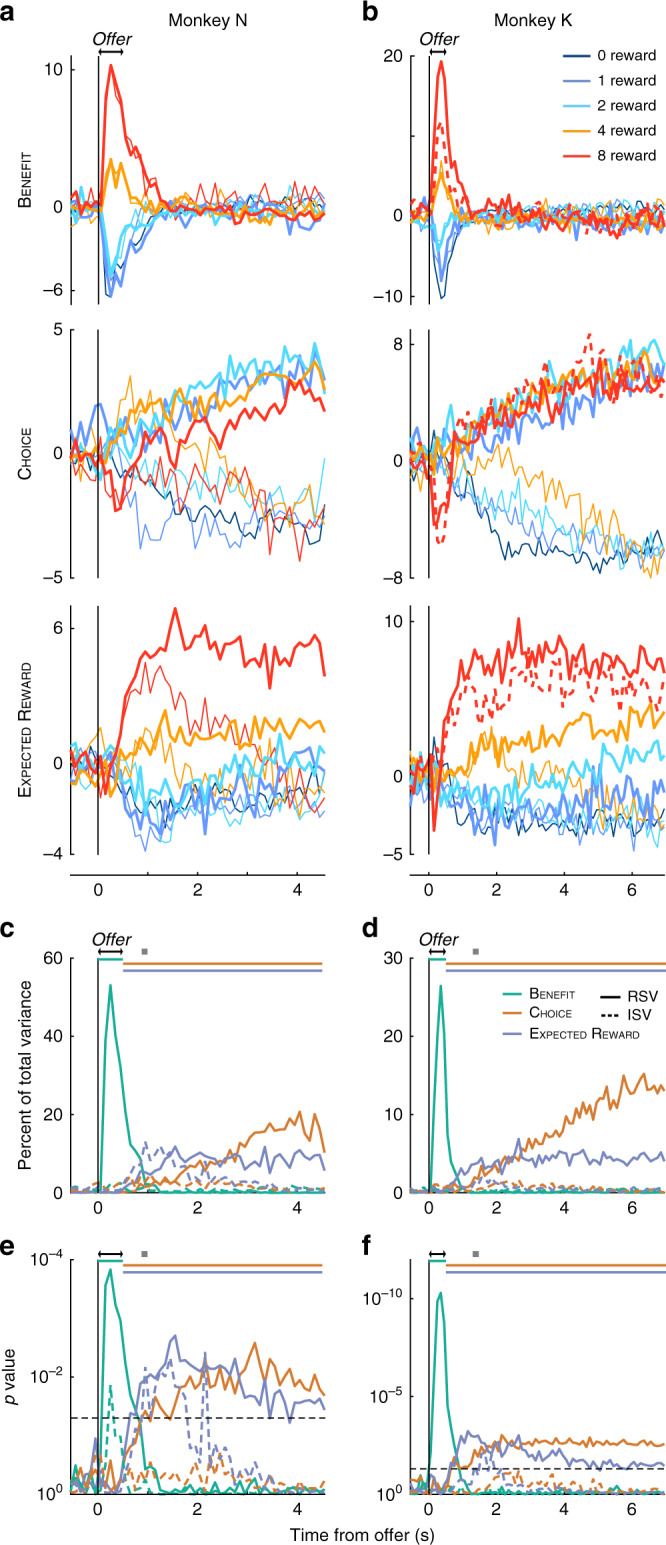
a, b The time course of the high-dimensional neural activity projected onto the low-dimensional representations (i.e., activity of the sRA) of benefit (top), choice (middle), and expected reward (bottom) is shown in arbitrary units for each offer size (colors) and accept and reject choices (thick and thin curves, respectively) as a function of time from the onset of the offer period (double arrows) for monkeys N (a) and K (b). The response to the singleton condition (dashed curve), which was excluded when computing the sRAs, tracked the offer’s value, not visual properties (see Supplementary Fig. 10 for monkey N). Note that some combinations of offer and choice (e.g., 0-reward, accept choices) had too few trials per unit to accurately estimate trial-average responses and were excluded (see “Methods”). The apparent bleed-through of offer information onto mid-trial choice activity for reject choices (middle panel, thin lines), was in part because rejections (and thus choice selectivity) occurred later for larger offers (Supplementary Figs. 2 and 8), and in part because the time-varying representations (i.e., dRAs) were correlated mid-trial (Supplementary Fig. 24, left column), despite orthogonal static representations. c, d The relevant and irrelevant signal variance (solid and dashed curves, respectively) for benefit (green), choice (orange), and expected reward (blue) are shown as a percentage of total cross-condition variance as a function of time from the onset of the offer period (double arrows) for monkeys N (c) and K (d). e, f Log10 probability (one-sided, uncorrected) of data in c and d, respectively, was derived empirically in comparison to random dimensions (see “Methods”). Horizontal dashed line corresponds to p = 0.05. In c–f, gray squares indicate the median rejection time and colored horizontal bars span the temporal epoch in which the color-matched sRAs were computed.