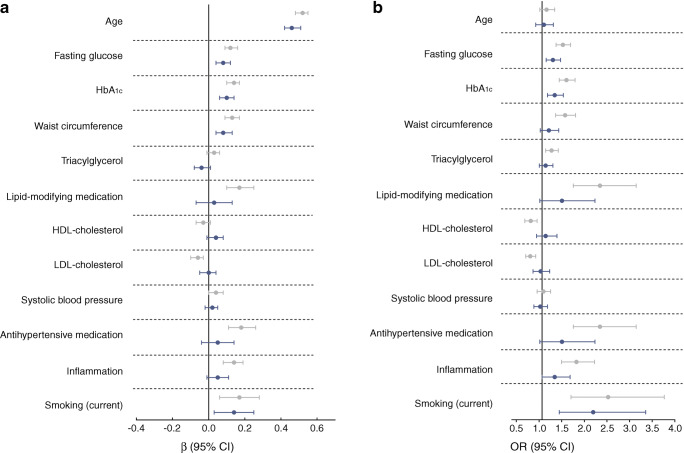
Fig. 2.
(a) Standardised associations (expressed as β with 95% CIs) of cardiometabolic risk factors and VPT. A higher threshold indicates worse score. (b) Standardised associations (expressed as ORs with 95% CIs) of cardiometabolic risk factors and neuropathic pain (OR >1 indicates greater likelihood for neuropathic pain). Associations in model 1 (grey) were adjusted for age, sex, height, educational level and skin temperature. Associations in model 2 (dark blue) were additionally adjusted for alcohol consumption, mobility limitations, CVD (history) and kidney function. In addition, all associations in model 2 were adjusted for each of the other risk factors with multivariate regression, with the exception of HbA1c. Further, HbA1c was not adjusted for fasting glucose

