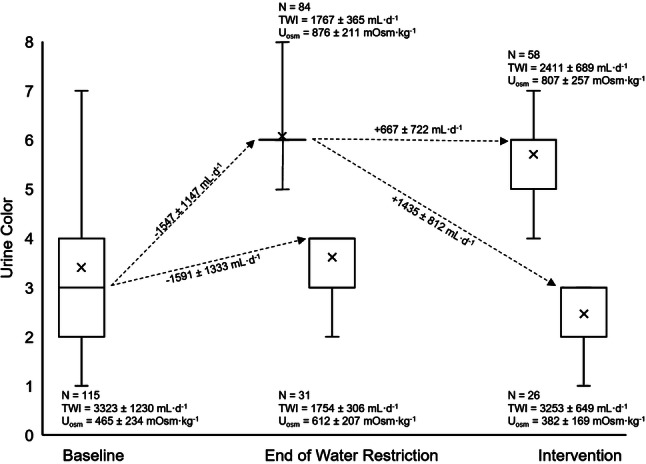
Fig. 3.

24-h urine color progression due to water restriction and graded rehydration intervention. The mean Ucol for each grouping is represented by the “X” each box. The median is the middle line within each box. The 25th and 75th percentiles are represented by the top and bottom horizontal lines of each box. In some cases, the 25th percentile, median, and/or 75th percentile were equal due to the ordinal nature of Ucol. All dashed arrow lines are drawn to and from the median of each grouping. The range of each grouping is represented by the height of the error bars. Changes in TWI are indicated on each line between boxes with + and − signs indicating increased or decreased TWI, respectively
