Figure 2.
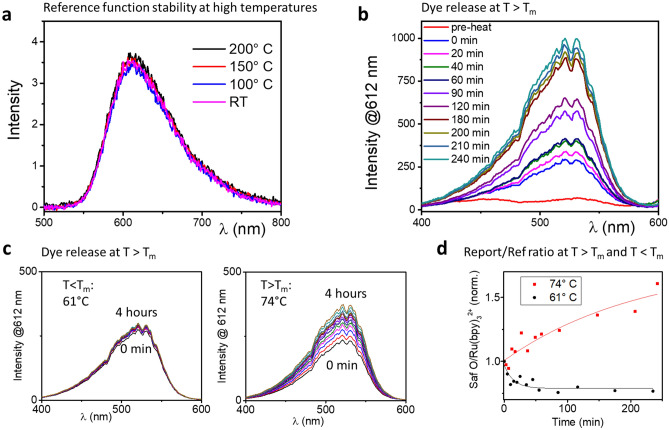
(a) Test of the reference signal stability by fluorescence spectroscopy of the signal of the Ru(bpy)32+ embedded in the nanoparticle core. Nanoparticle solutions of equal concentrations were exposed over 72 h to conditions of room temperature and atmospheric pressure (purple curve), 100 °C and 1.01 bar (blue curve), 150 °C and 4.76 bar (red curve) and 200 °C and 15.55 bar (black curve). (b) In-situ time-resolved fluorescence spectroscopy of a core–shell–tetracosane hull nanoparticle solution, conducted by sweeping the excitation wavelength and measuring the resulting emission at the 612 nm wavelength. The different measurements were taken at the noted times after reaching the solution target temperature of 52 °C with first measurement taken before heating commenced (pre-heat) and the next measurement immediately upon reaching the target temperature (noted as 0 min). (c) In-situ time-resolved fluorescence spectroscopy of a core–shell–dotriacontane hull nanoparticle solution, conducted in the same manner as in b. The spectra displayed on the left were obtained over 4 h from a solution heated to 61 °C while the spectra on the right were obtained from a solution heated to 74 °C. (d) A graph showing the evolution over time of the signal/ref ratio derived from the fluorescence spectroscopy of the 74 °C (red curve) and 61 °C (black curve) heated solutions displayed on c. The signal/ref ratio was normalized to the ratio at the starting point of the experiment.

