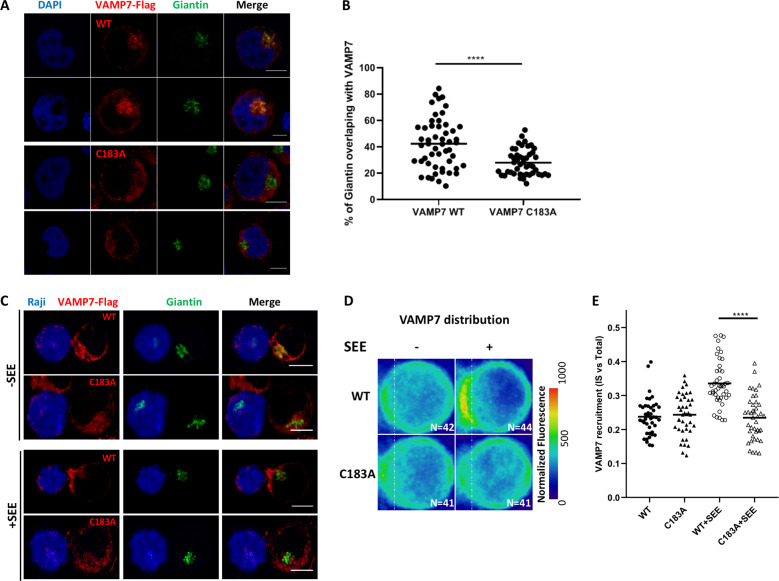
Fig. 3. The VAMP7-C183A mutant fails to properly localize to the Golgi.
a Confocal images showing the relative localization of VAMP7 (red) labelled with anti-Flag Abs and Giantin (green) in VAMP7-KO Jurkat cells expressing the WT VAMP7-FLAG or the mutant VAMP7-C183A-FLAG proteins. Scale bar 5 μm. b Dot plots showing the quantification of the percentage of Giantin (Golgi marker) overlapping with the VAMP7-FLAG proteins (Manderson coefficient). Each dot = one cell; horizontal lines = median. ****p < 0.0001 (one-way ANOVA). c Representative confocal images of conjugates of Jurkat VAMP7-KO cells expressing the WT VAMP7-FLAG or the mutant VAMP7-C183A-FLAG proteins and SEE-pulsed Raji B cells (blue) labeled with anti-FLAG (VAMP7-FLAG, showed in red) or anti-Giantin (shown in green) antibodies, assessed at 15 min. Scale bar 5 μm. d Mapping and e quantification of the enrichment of VAMP7 at the immune synapse (depicted by the dotted white line) in Jurkat “mean cells” interacting for 15 min with Raji cells left unpulsed (−, inactivated state) or pulsed with SEE (+, immune synapse formation). N number of cells constituting the mean image. Horizontal lines represent median. Scale bar 5 μm. Each dot = one cell; horizontal lines = median. ****p < 0.0001 (t-test and one-way ANOVA). Data are from two independent experiments.

