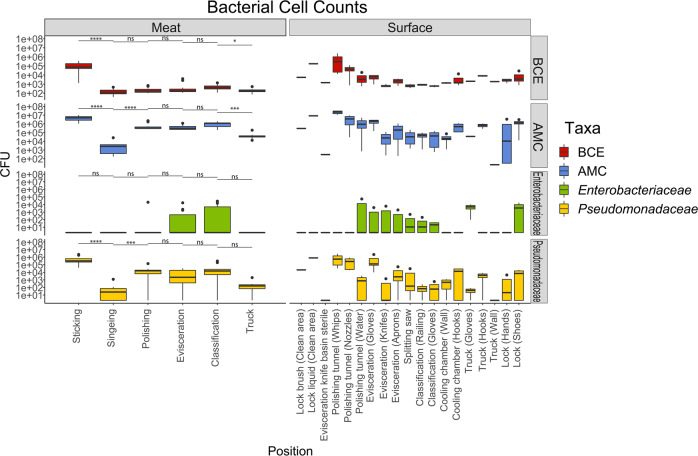
Fig. 1. Microbial numbers at the different sampling positions.
Bacterial cell equivalents (BCE) and colony forming units (CFU) of aerobic mesophilic counts (AMC), Enterobacteriaceae (EB), and Pseudomonadaceae (PS) for the different sampling positions. Boxes indicate the interquartile range (75th–25th) of the data. The median value is shown as a line within the box. Whiskers extend to the most extreme value within 1.5 * interquartile range. Levels of significance: ns: p > 0.05, *p ≤ 0.05, **p ≤ 0.01, ***p ≤ 0.001.

