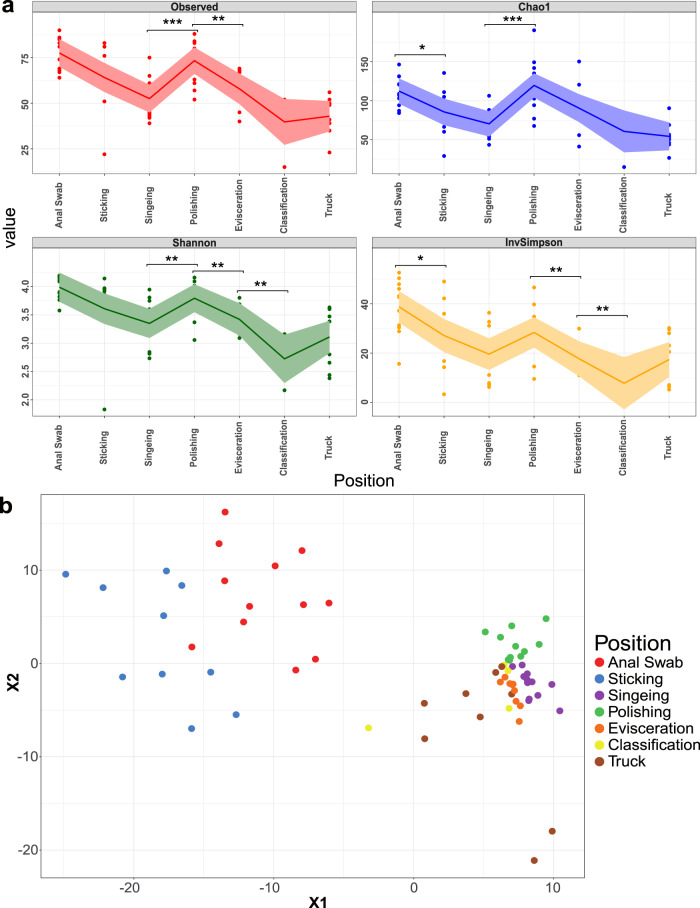
Fig. 2. Diversity of microbial communities associated with meat samples.
a Change in alpha diversity indices of meat samples over time. Points represent individual samples, the trend lines connect the means, and shaded regions indicate the standard error. Levels of significance: *p ≤ 0.05, **p ≤ 0.01, ***p ≤ 0.005. b t-SNE plot of Bray–Curtis distances based on 16S rRNA gene libraries. Each point represents values from individual libraries with colors expressing meat samples from different positions along the processing line.

