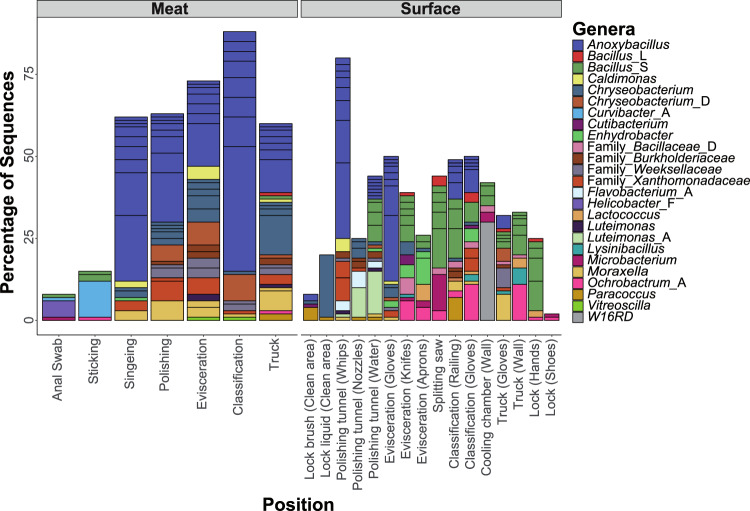
Fig. 3. Genus-level classification of the 50 most abundant ASVs parted by type (meat or surface).
Data represents average of ASV counts from replicate libraries for each category. Individual ASVs are separated by a black line within the bar graph. ASVs assigned to candidate genera that do not have a name assignment yet are indicated with “Family_”. Genera names with an alphabetic suffix indicate genera that are polyphyletic and were therefore subdivided in the genome taxonomy database.

