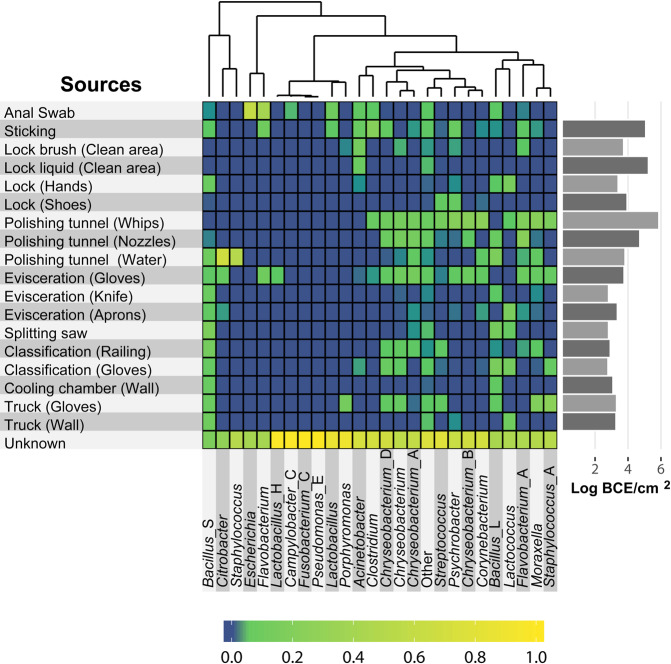
Fig. 5. Heatmap showing the predicted relative contribution of specific genera from different source environments.
Only taxa that are associated with meat spoilage or include relevant pathogens are shown. Non-relevant taxa were grouped into a single group called “Other”. The relative contribution of each genus (columns) from each source (rows) is indicated by the color of the intersecting tile. Taxa are clustered by shared-source similarity. BCE: bacterial cell equivalents as determined by 16S rRNA gene qPCR.

