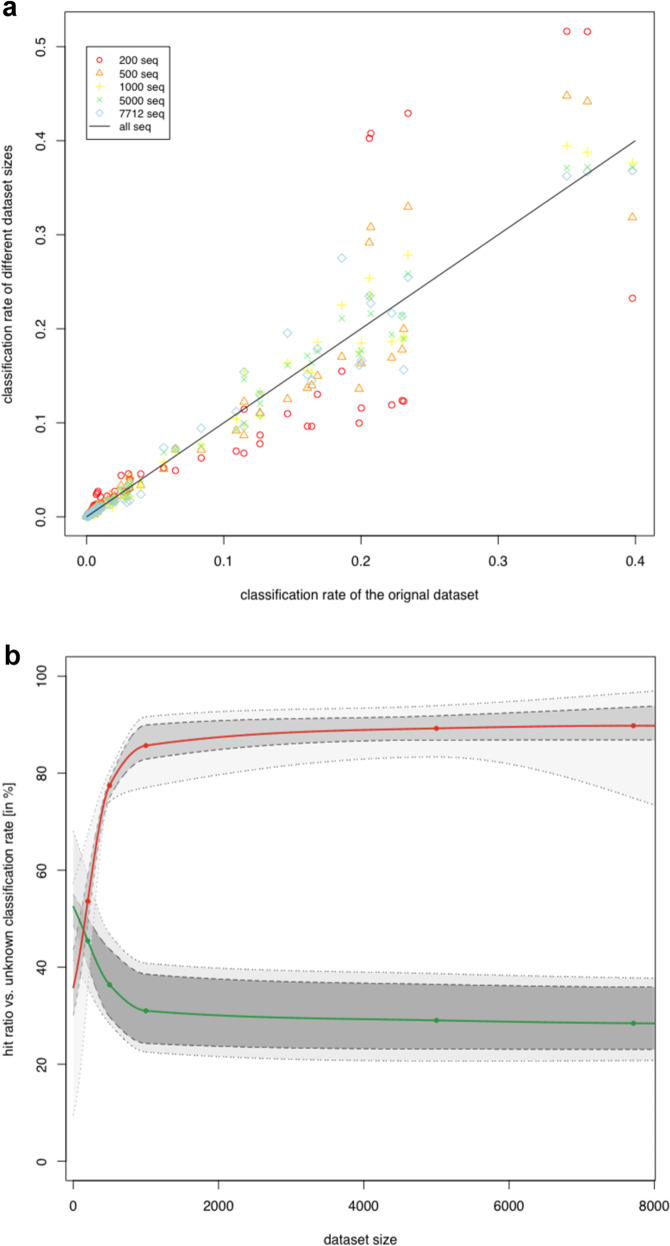
Fig. 6. Simulation of the effect of sequencing depth on SourceTracker performance.
a The correlation of the different dataset sizes compared to the original dataset. b The hit ratio (red points) and unknown classified sequences (green points) for the different used dataset sizes, with extrapolation values for not tested dataset sizes shown as solid lines. Dotted lines presented the min–max values and the dashed lines indicated the 25th and 75th percentile of-hit ratio and unknown classified sequences.

