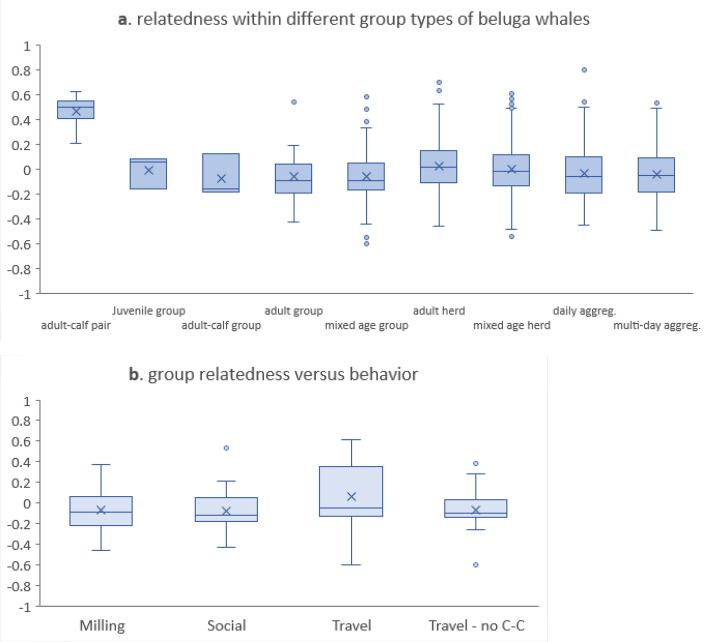
Figure 6.
Box and whisker plots showing the patterns of relatedness within and between beluga whale group types and behaviors. The median (horizontal bar) not the mean was used as the central tendency. Boxes encompass the inter-quartile range (IQR) around the median, and the whiskers capture the range that is 1.5 times the IQR. Values outside this range were identified as outliers. (a) Observed pairwise r across group types; (b) observed r by behavioral category. Travel was assessed for all group types including adult–calf dyads (labelled ‘Travel’), as well as for all group types excluding the adult–calf dyads (labelled ‘Travel—no C–C’).

