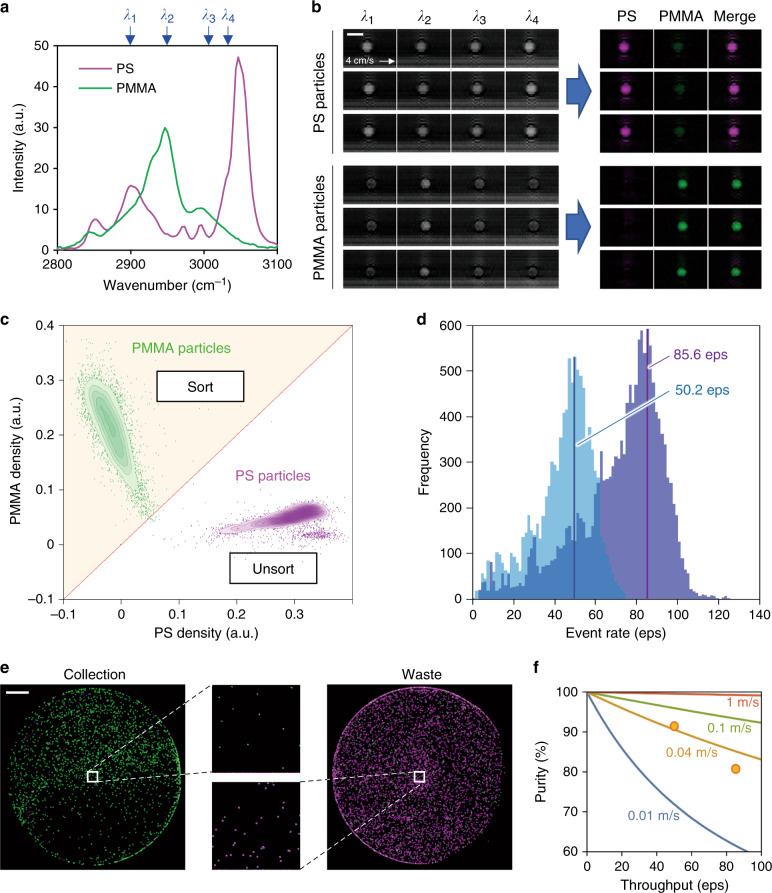
Fig. 2. Basic performance of the RIACS.
a SRS spectra of PS and PMMA particles obtained by an SRS microscope. Four wavenumbers (2899, 2954, 3006, 3034 cm−1) were selected and used to decompose SRS images into two chemical species. b SRS images of PS and PMMA particles (representative of n = 9786 and n = 4063, respectively) at the four wavenumbers and decomposed images of the particles. Scale bar, 10 µm. c Scatter plot of the particles in PS and PMMA intensities per particle area (referred to as PS/PMMA densities) with the sort region (yellow). d Histograms of event rates in two sorting experiments (nominal throughput values: 50.2 eps, 85.6 eps). e Fluorescence images of sorted and unsorted particles in the collection and waste tubes, respectively (n = 2). The insets show enlarged images of the sorted and unsorted particles. Scale bar: 1 mm. f Theoretical estimation of the throughput-purity relation at various flow speed values together with our experimental verification (orange dots).

