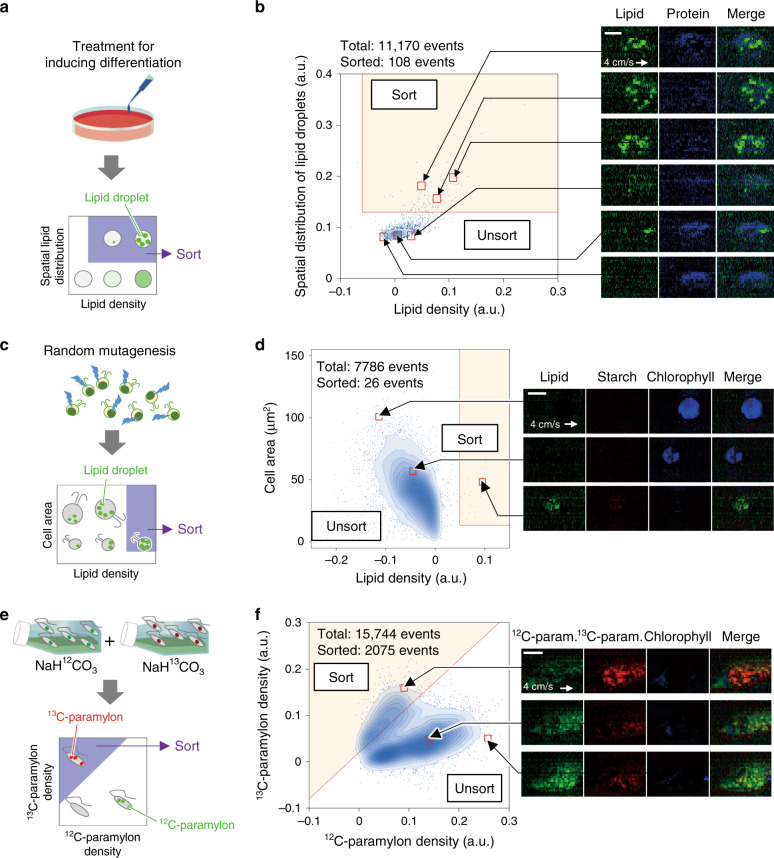
Fig. 4. Raman image-activated sorting of various types of cells with the RIACS.
a Procedure for sorting adipocyte-like cells. b Scatter plot of differentiated and undifferentiated 3T3-L1 cells in the spatial distribution of intracellular lipid droplets and the lipid intensity per cell area. 3T3-L1-derived adipocyte-like cells with a large spatial distribution of cytoplasmic lipid droplets (indicated by the yellow region) were sorted by the RIACS. The insets show representative SRS images of cells in the sort (n = 108) and unsort regions (n = 11,068). Scale bar: 10 µm. c Procedure for sorting Chlamydomonas sp. cells. d Scatter plot of Chlamydomonas sp. mutant cells in cell area and lipid density. Highly lipid-rich, but rare (only 0.3% of the total population) Chlamydomonas sp. mutants (indicated by the yellow region) were sorted by the RIACS. The inset shows representative SRS images of cells in the sort (n = 26) and unsort regions (n = 7760). Scale bar: 10 µm. e Procedure for sorting Euglena gracilis cells. f Scatter plot of the 50/50 mixture of Euglena gracilis cells cultured in NaH12CO3 and NaH13CO3 in 12C- and 13C-paramylon intensity per cell area. Euglena gracilis cells cultured in NaH13CO3 (indicated by the yellow region) were sorted by the RIACS. The inset shows representative SRS images of cells in the sort (n = 2075) and unsort regions (n = 13,669). Scale bar: 10 µm.

