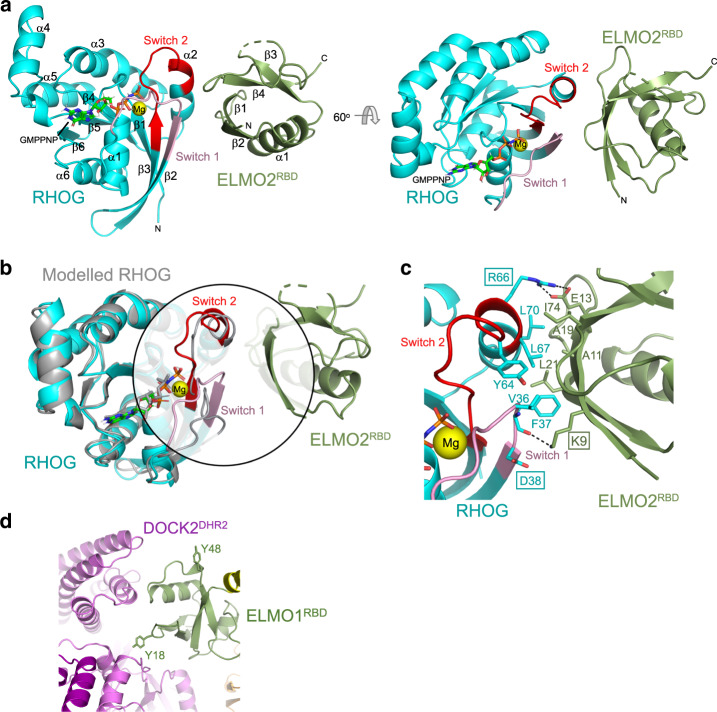
Fig. 4. Crystal structure of the RHOG–ELMO2RBD complex.
a Structure of RHOG complexed with ELMO2RBD. The switch 1 (pink) and switch 2 (red) regions of RHOG are highlighted. GMPPNP is shown in stick form and the bound Mg2+ ion (yellow). b Superimposition of the RHOG–ELMO2RBD structure with that of the modelled GDP-bound RHOG (grey, based on RHOA; PDBid 1FTN). The switch 1, switch 2 and binding interface with ELMO2RBD are highlighted in the circle. The switch 1 region of inactive RHOA is noticeably shifted outward. c Detailed view of the RHOG–ELMO2RBD binding interface. Residues involved in the interaction are labelled and shown with side chains in stick form. d In the closed-inactive conformation of DOCK2–ELMO1, Tyr18 contacts DOCK2DHR2. Phosphorylation of Tyr18 by TAM kinases would destabilize DOCK2DHR2–ELMO1RBD interactions, thereby stimulating DOCK2 GEF activity.

