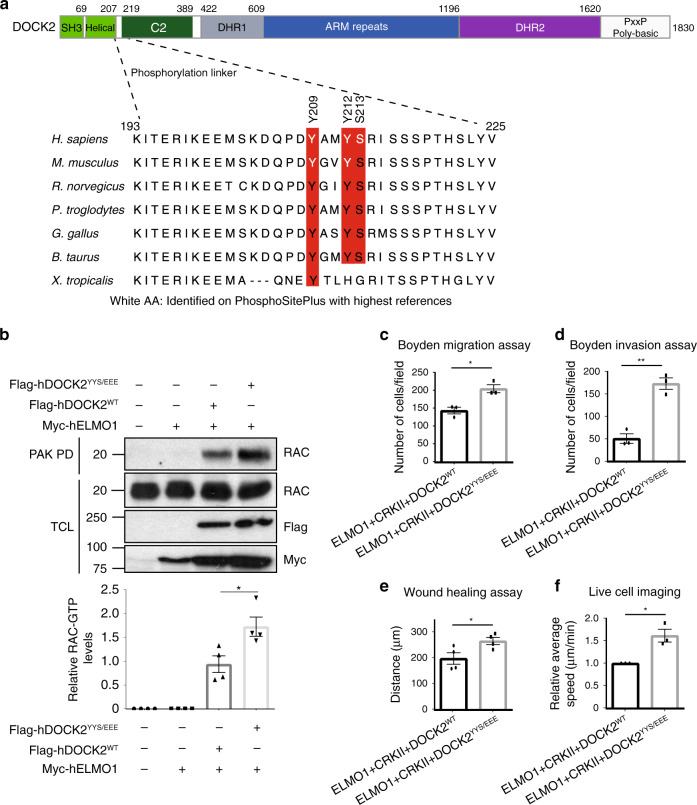
Fig. 7. Phosphorylation of DOCK2 at the ELMONTD–DOCK2C2 interface promotes RAC1 signalling.
a DOCK2 sequence alignment. Schematic of DOCK2 domains is shown. The aligned region is indicated within dashed lines. Sites highlighted in red are conserved within the different species. White labelled amino acids were identified on PhosphositePlus with the highest references. b RAC1 activation levels are increased upon DOCK2YYS/EEE expression. 293 T cells transfected with the indicated plasmids were subjected to a RAC activation assay (GST-PAK1 PBD pulldown). RAC activation levels were detected by western blotting and quantified using ImageJ. Three biologically independent experiments were performed with similar results. Boyden migration (c) and invasion (d) assay performed with HeLa cells transfected with the indicated plasmids. Number of cells migrated were counted by DAPI staining of the membrane (the experiments were performed three times, imaging 10 fields using a 10X objective per condition). e Quantifications of transfected HeLa cells displacement in a wound healing assay. The experiments were performed four times, imaging four fields using a 10X objective per condition. f Average speed of transfected HeLa cells time-lapse imaged for 6 h. Average speed was quantified using manual tracking on ImageJ. The experiments were performed three times, imaging four fields used at 10X per condition per experiment. Data were analysed from three experiments and expressed as mean ± s.e.m. Two-tailed unpaired student’s t test was used (c, d, e, f) and Mann–Whitney test (b). (*p = 0.0286 (b); *p = 0.0138 (c); **p = 0.0017 (d); *p = 0.0424 (e); *p = 0.0123 (f)). Source data are provided as a Source Data file.

