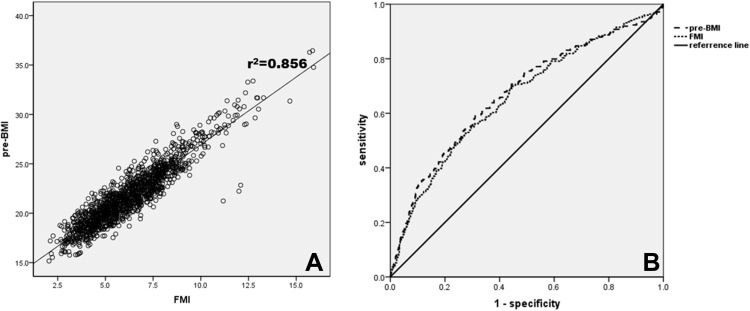
Figure 2.
Correlation between pre-BMI and FMI and receiver-operating characteristic (ROC) curve to predict GDM. (A) Correlation between Pre-BMI and FMI. There was a significant correlation between pre-BMI and FMI (r=0.925, p<0.001). (B) ROC curve predicts the presence of GDM. The AUC of FMI and Pre-BMI is 0.658 (p<0.001) and 0.672 (p<0.001), respectively. The DeLong test shows that the difference of AUC between FMI and Pre-BMI is not significant (p=0.093).

