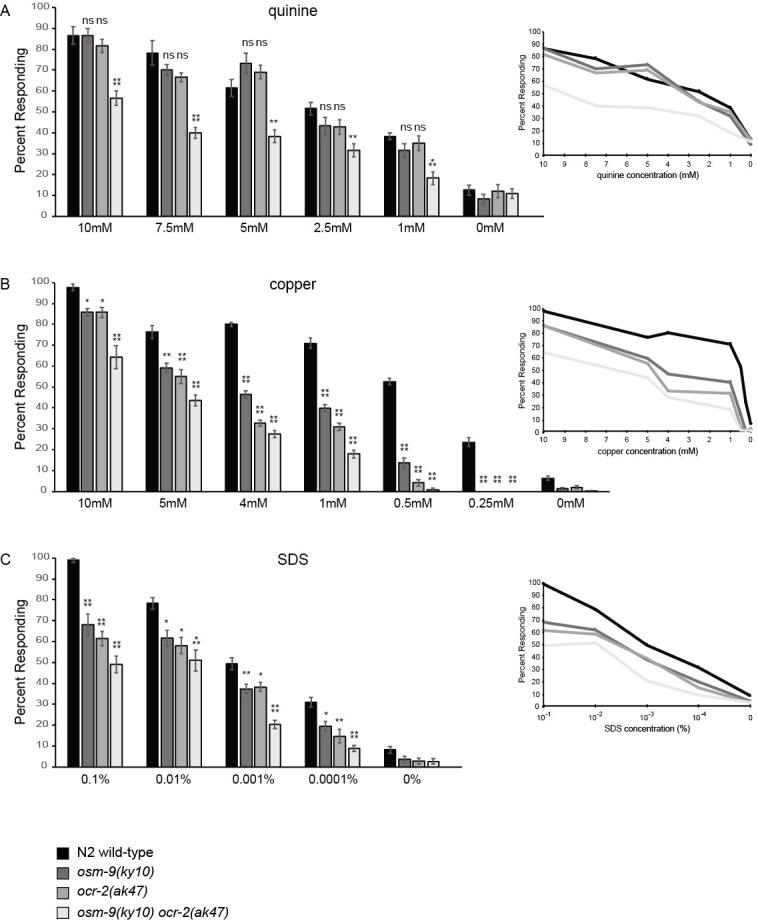
Figure 1.

Behavioral response of well-fed young adults to aversive chemical stimuli was assessed using the drop assay 20 minutes after transfer to NGM plates lacking bacteria (“off food”). Bar graphs show the percentage of animals responding to the indicated concentrations of (A) the bitter tastant quinine, (B) the heavy metal copper (CuCl2), and (C) the detergent SDS. Inserts represent the corresponding dose-response curves for each genotype across the range of concentrations tested, for readability showing only the means from the bar graphs in panels A-C. n >/= 60 animals for each genotype were assayed at each concentration. Assays were performed on at least three separate days. All tastants were dissolved in M13 buffer, pH 7.4 (Wood 1988). Error bars represent the standard error of the mean (SEM). The one-way ANOVA with Tukey’s Honestly Significant Difference (HSD) was used for statistical analysis. * denotes p < 0.05, ** denotes p < 0.01, *** denotes p < 0.001, and **** denotes p < 0.0001 compared to wild-type animals. ns denotes p >/= 0.05. F values for 10mM – 1mM quinine, respectively: 16.7, 20.4, 16.1, 5.6, 9.2. F values for 10mM – 0.25mM copper, respectively: 19.9, 22.6, 245.7, 133.8, 212.5, 112.7. F values for 0.1% – 0.0001% SDS, respectively: 29.9, 7.6, 24.0, 11.5.
