Figure 3.
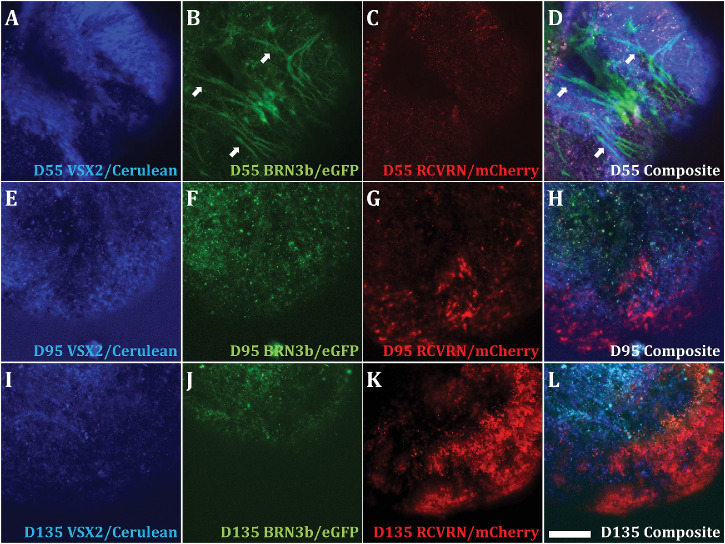
Functional analysis of the fluorescent reporters in the PGP1 line via retinal organoid formation. Single three-dimensional retinal organoids derived from the PGP1 hiPSC line were visualized by fluorescent microscopy at D55 (A, B, C, D), D95 (E, F, G, H), and D135 (I, J, K, L) of differentiation. Organoids were visualized with a 458-nm laser to excite Cerulean, driven by the VSX2 promoter (A, E, I); a 488-nm laser to excite eGFP, driven by the BRN3b promoter (B, F, J); and both 543-nm and 633-nm lasers to excite mCherry, driven by the RCVRN promoter (C, G, K). Composite images represent the merger of all three fluorescent signals (D, H, L). The eGFP signal was targeted to the cell membrane by a GAP43 tag to allow for visualization of ganglion cell axon bundles (white arrows in B, D). As organoids matured from D55 to D135, the number of cells expressing mCherry dramatically increased (compare C and K), and the eGFP+ cells populated the interior of the organoid (J) while the mCherry+ cells occupied the organoid periphery (K). Magnification bar: 100 µm. Scanning parameters are in Supplementary Table S9.

