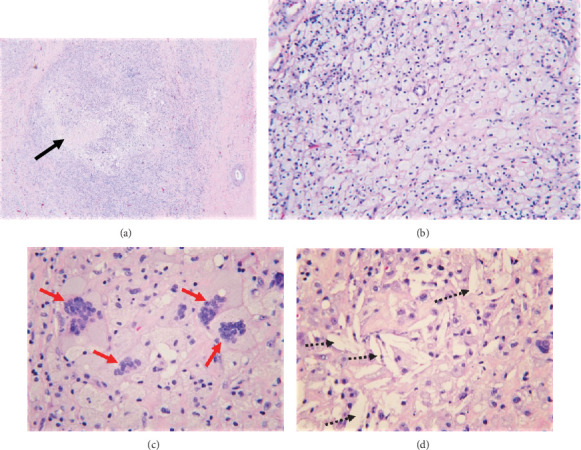
Figure 2.

H&E staining (a) shows a diffuse cellular infiltrate with areas of necrosis (black arrow). Higher power at 200x (b) shows the infiltrate composed of numerous foamy macrophages with abundant pink cytoplasm, scattered lymphocytes, (c) multinucleated giant cells (red arrows), and (d) cholesterol clefts (dashed arrows).
