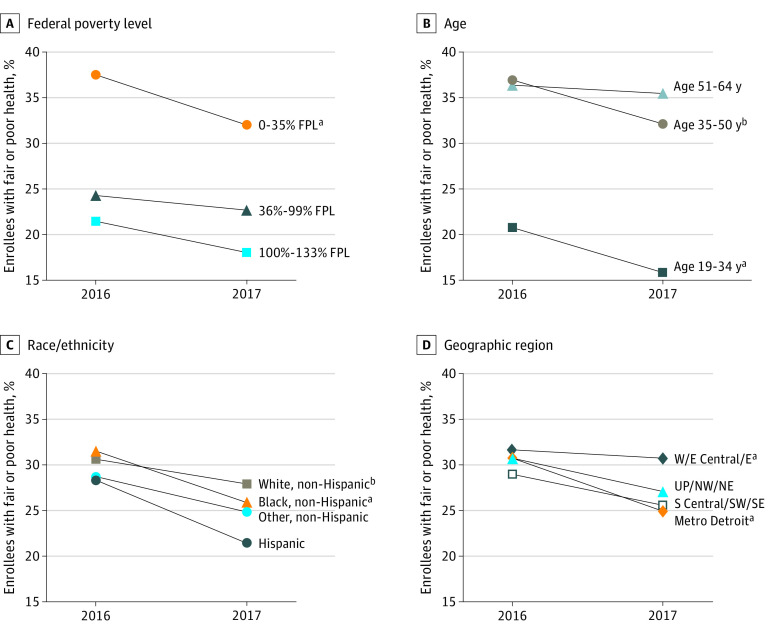
Figure 1. Changes Among All Enrollees in Fair or Poor Health From 2016 to 2017 by Select Demographic Characteristics.
Data are weighted for sampling probability and nonresponse. E indicates Eastern Michigan; E Central, Eastern Central Michigan; FPL, federal poverty level; Metro, metropolitan; NE, Northeastern Michigan; NW, Northwestern Michigan; S Central, Southern Central Michigan; SE, Southeastern Michigan; SW, Southwestern Michigan; UP, Upper Peninsula; and W, Western Michigan. Mixed-effects logistic regression models restricted to each group category were used to test for a significant change over time.
aP < .01.
bP < .05.

