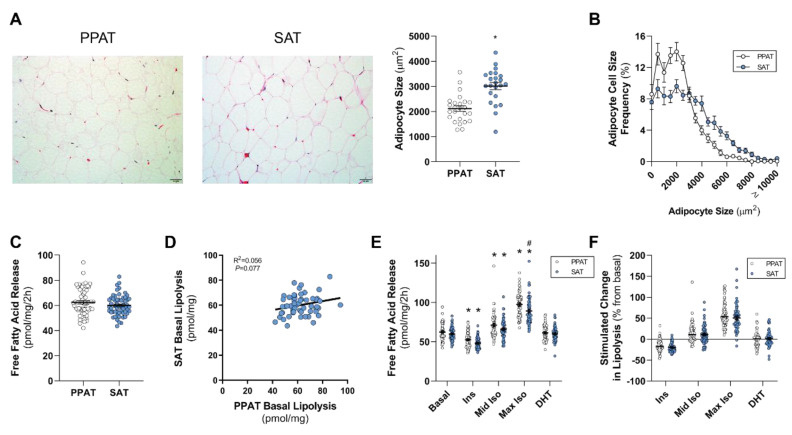
Figure 1.
Periprostatic and subcutaneous adipose tissue adipocyte size and lipolysis. (A) Representative images and mean and (B) distribution of adipocyte size of periprostatic adipose tissue (PPAT) and subcutaneous adipose tissue (SAT); (C) basal fatty acid release rates from PPAT and SAT and (D) linear regression analysis of PPAT and SAT basal free fatty acid release. (E) Absolute free fatty acid release from PPAT and SAT in response to 10 nM insulin (Ins), 10 nM (mid Iso), and 1 µM (max Iso) isoproterenol, and 1 nM dihydrotestosterone (DHT). (F) Change in PPAT and SAT fatty acid release from the basal rate in response to 10 nM insulin (Ins), 10 nM (mid Iso), and 1 µM (max Iso) isoproterenol, and 1 nM dihydrotestosterone (DHT). All data were expressed as mean ± SEM. * p < 0.05 by a non-parametric Mann–Whitney U-test (A,C,F); * p < 0.05 vs. basal (same fat bed), # p < 0.05 vs. PPAT by a two-way ANOVA (E). N = 20 for A and B, N = 60 for C–F. Scale bar: 50 µm.

