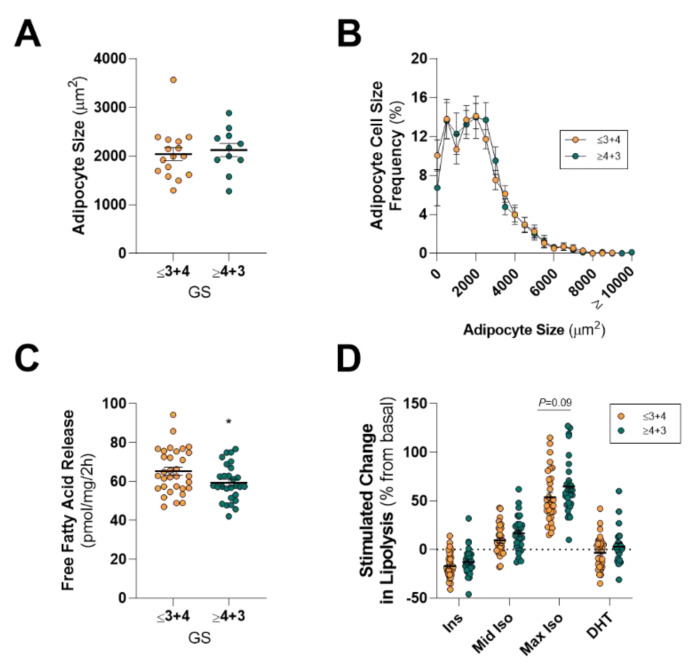
Figure 2.
Comparison of periprostatic adipose tissue adipocyte size and lipolysis in men with less aggressive and more aggressive prostate cancer. (A) Mean and (B) distribution of adipocyte size of periprostatic adipose tissue (PPAT) dichotomized into Gleason score ≤3 + 4 (less aggressive) and ≥4 + 3 (more aggressive) groups; (C) Basal fatty acid release rates and (D) absolute free fatty acid release from PPAT in response to 10 nM insulin (Ins), 10 nM (mid Iso) and 1 µM (max Iso) isoproterenol, and 1 nM dihydrotestosterone (DHT) dichotomized into Gleason score ≤3 + 4 (less aggressive) and ≥4 + 3 (more aggressive) groups. All data was expressed as mean ± SEM. (A,B) GS ≤ 3 + 4, n = 16; ≥4 + 3, n = 11. (C,D) GS ≤ 3 + 4, n = 32; ≥ 4 + 3, n = 28. * p < 0.05 by a non-parametric Mann–Whitney U-test (C), * p < 0.05 by a two-way ANOVA (D).

