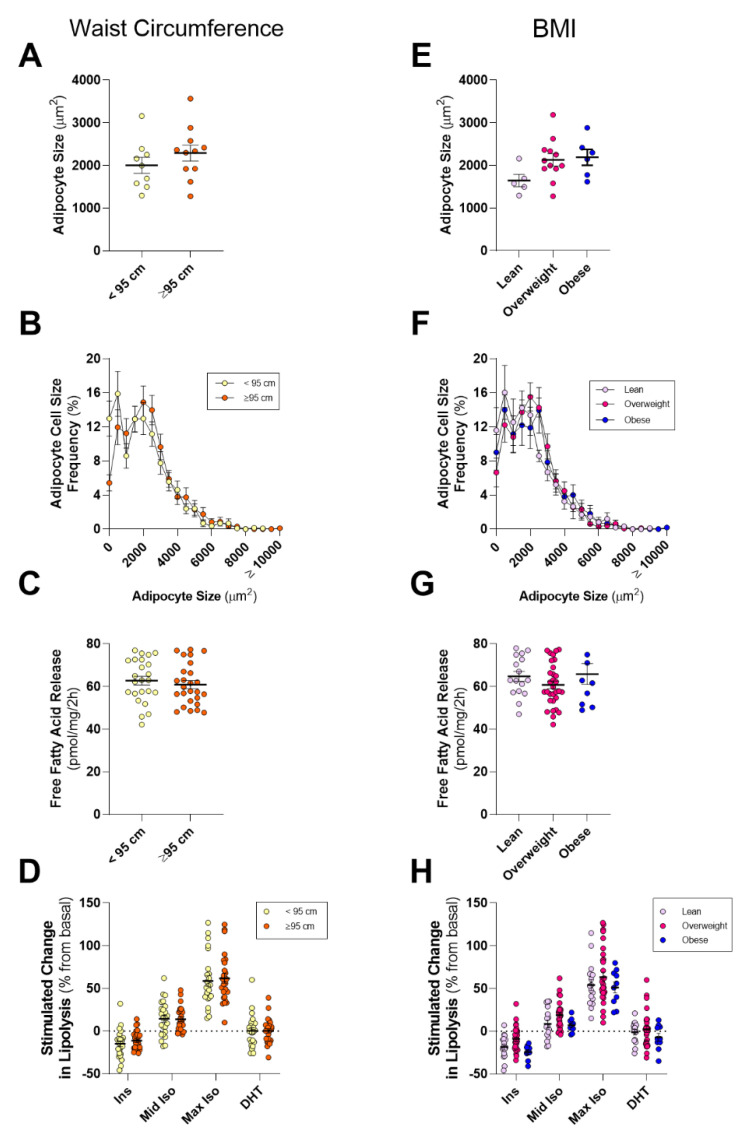
Figure 3.
Comparison of periprostatic adipose tissue adipocyte size and lipolysis in lean or obese men with prostate cancer. (A) Mean and (B) distribution of adipocyte size of periprostatic adipose tissue (PPAT) dichotomized into waist circumference <95 cm (normal) and ≥95 cm (high) groups. (C) Basal fatty acid release rates and (D) absolute free fatty acid release from PPAT in response to 10 nM insulin (Ins), 10 nM (mid Iso), and 1 µM (max Iso) isoproterenol, and 1 nM dihydrotestosterone (DHT) dichotomized into waist circumference <95 cm (normal) and ≥95 cm (high) groups. (E) Mean and (F) distribution of adipocyte size of periprostatic adipose tissue (PPAT) stratified by BMI into Lean (<25 kg/m2), Overweight (≥25 kg/m2, <30 kg/m2), and Obese (≥30 kg/m2) groups. (G) Basal fatty acid release rates and (H) absolute free fatty acid release from PPAT in response to 10 nM insulin (Ins), 10 nM (mid Iso) and 1 µM (max Iso) isoproterenol, and 1 nM dihydrotestosterone (DHT) stratified by BMI into Lean, Overweight and Obese groups. PPAT n = 25, ≤95 cm n = 9, ≥95 cm n = 11, Lean n = 7, Overweight n = 12, Obese n = 6. SAT n = 25, ≤95 cm n = 6, ≥95 cm n = 12, Lean n = 7, Overweight n = 11, Obese n = 5. Data are mean ± SEM.

