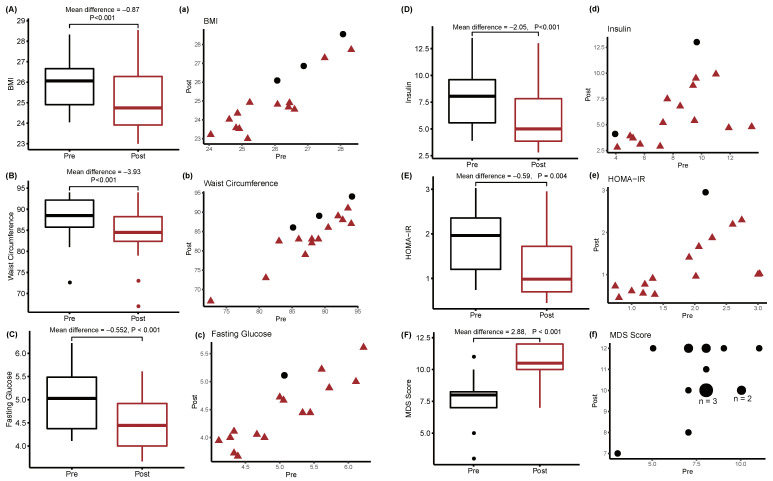
Figure 1.
Changes in metabolic indices induced by the MD in overweight breast cancer survivors. The panels annotated by the capital letters (A–F) represent box-whisker plots of metabolic indices before and after intervention. p-values were calculated by the paired Student’s t-test after Kolmogorov–Smirnov test. The panels annotated by the lowercase letters (a–f) represent scatter plots of the same data as in (A–F). Red triangles indicate values that decreased after the intervention. Black circles indicate values that increased after the intervention.

