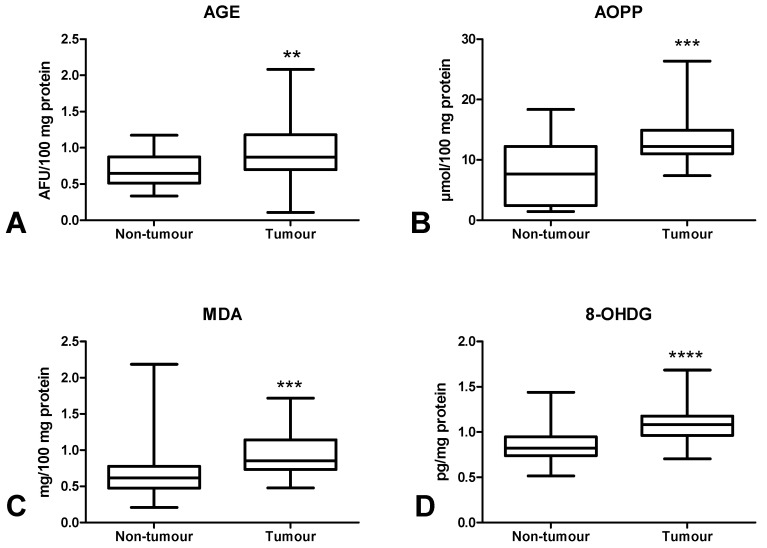
Figure 8.
Comparison of AGE (A), AOPP (B), MDA (C) and 8-OHdG (D) concentration between colorectal cancer tissue (n = 29) and normal mucosa (n = 29). The data are presented as median (minimum–maximum). Abbreviations: AGE—advanced glycation end products, AOPP—advanced oxidation protein products, MDA—malondialdehyde, 8-OHdG—8-hydroxydeoxyguanosine. ** p < 0.01, *** p < 0.001, **** p < 0.0001.

