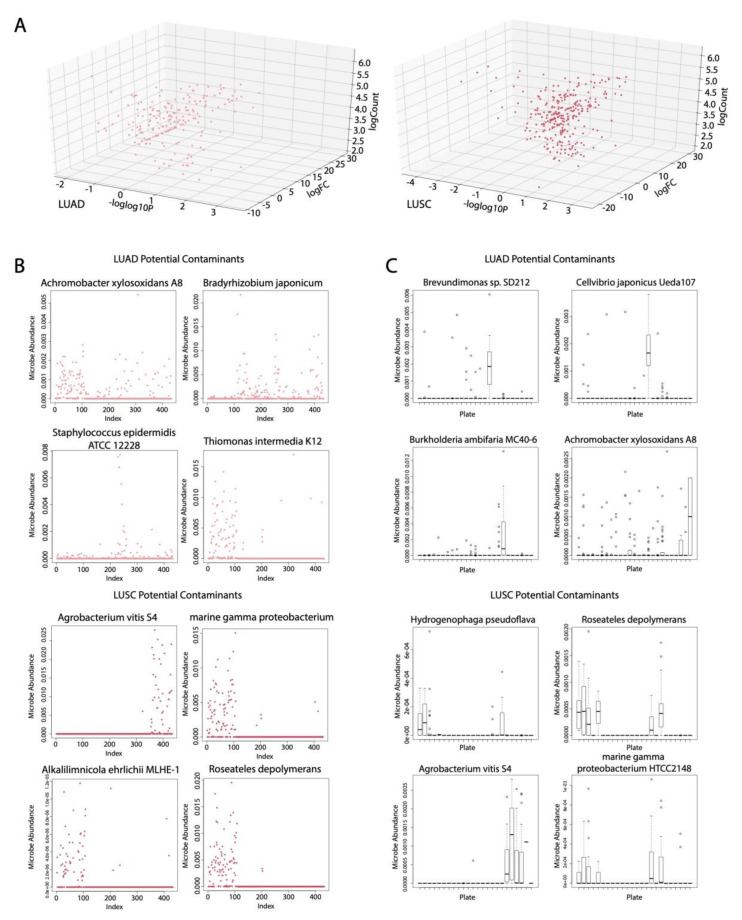
Figure 2.
Contamination correction results. (A) Differentially abundant microbes from comparing cancer samples vs. normal samples in LUAD and LUSC (Kruskal–Wallis test, p < 0.05). (B) Dot plot visualizing potential microbial contaminants according to date sequenced using an algorithm that relies on divisive clustering of abundance for LUAD and LUSC. (C) Boxplots depicting potential microbial contaminants according to the plate ID for LUAD and LUSC (p < 0.05).

