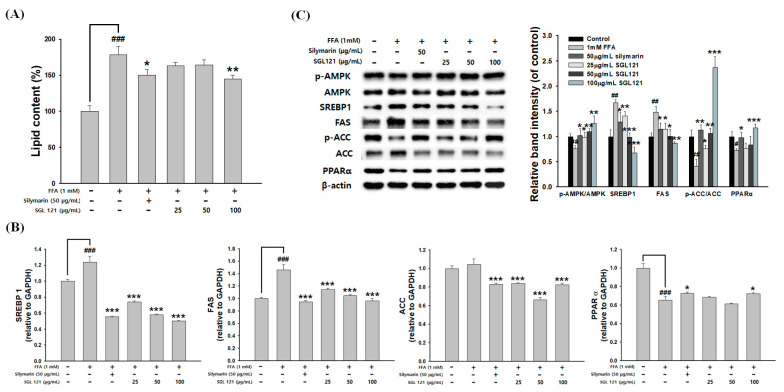
Figure 8.
Effects of SGL 121 on lipid accumulation and lipogenesis in HepG2 Cells. (A) Lipid accumulation of Oil red O contents was quantified by spectrophotometric analysis, (B) relative mRNA levels of SREBP-1, FAS, acetyl CoA carboxylase (ACC), and peroxisome proliferator-activated receptor α (PPARα) were assayed by real-time PCR analysis, and (C) protein expression of p-adenosine monophosphate-activated protein kinase (AMPK), AMPK, SREBP-1, FAS, p-ACC, ACC, and PPARα was determined by Western blotting. The graph indicates the expression level against β-actin expression level. Data are presented as the mean ± SD. ## p < 0.01 and ### p < 0.001 compared to the control. * p < 0.05, ** p < 0.01 and *** p < 0.001 compared to free fatty acids (FFA) treatment alone.

