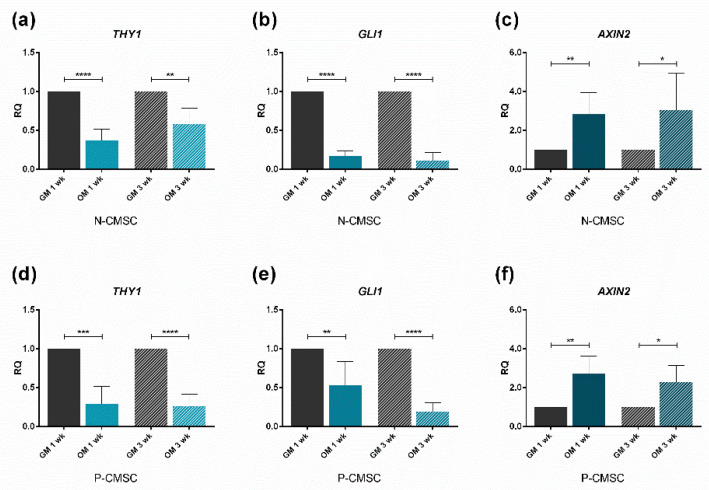
Figure 6.
Expression profiles of putative niche marker genes. Transcript levels of: (a,d) THY1; (b,e) GLI1; and (c,f) AXIN2, evaluated by qPCR in N-CMSC and P-CMSC, respectively, cultured with osteogenic medium (OM) for one (1 wk) and three weeks (3 wk). Cells cultured in standard growth medium (GM) were tested as controls at each time point. RQ, Relative Quantity (see Methods for details). * p < 0.05; ** p < 0.01; *** p < 0.001; **** p < 0.0001.

